Turn air quality data into operational insight
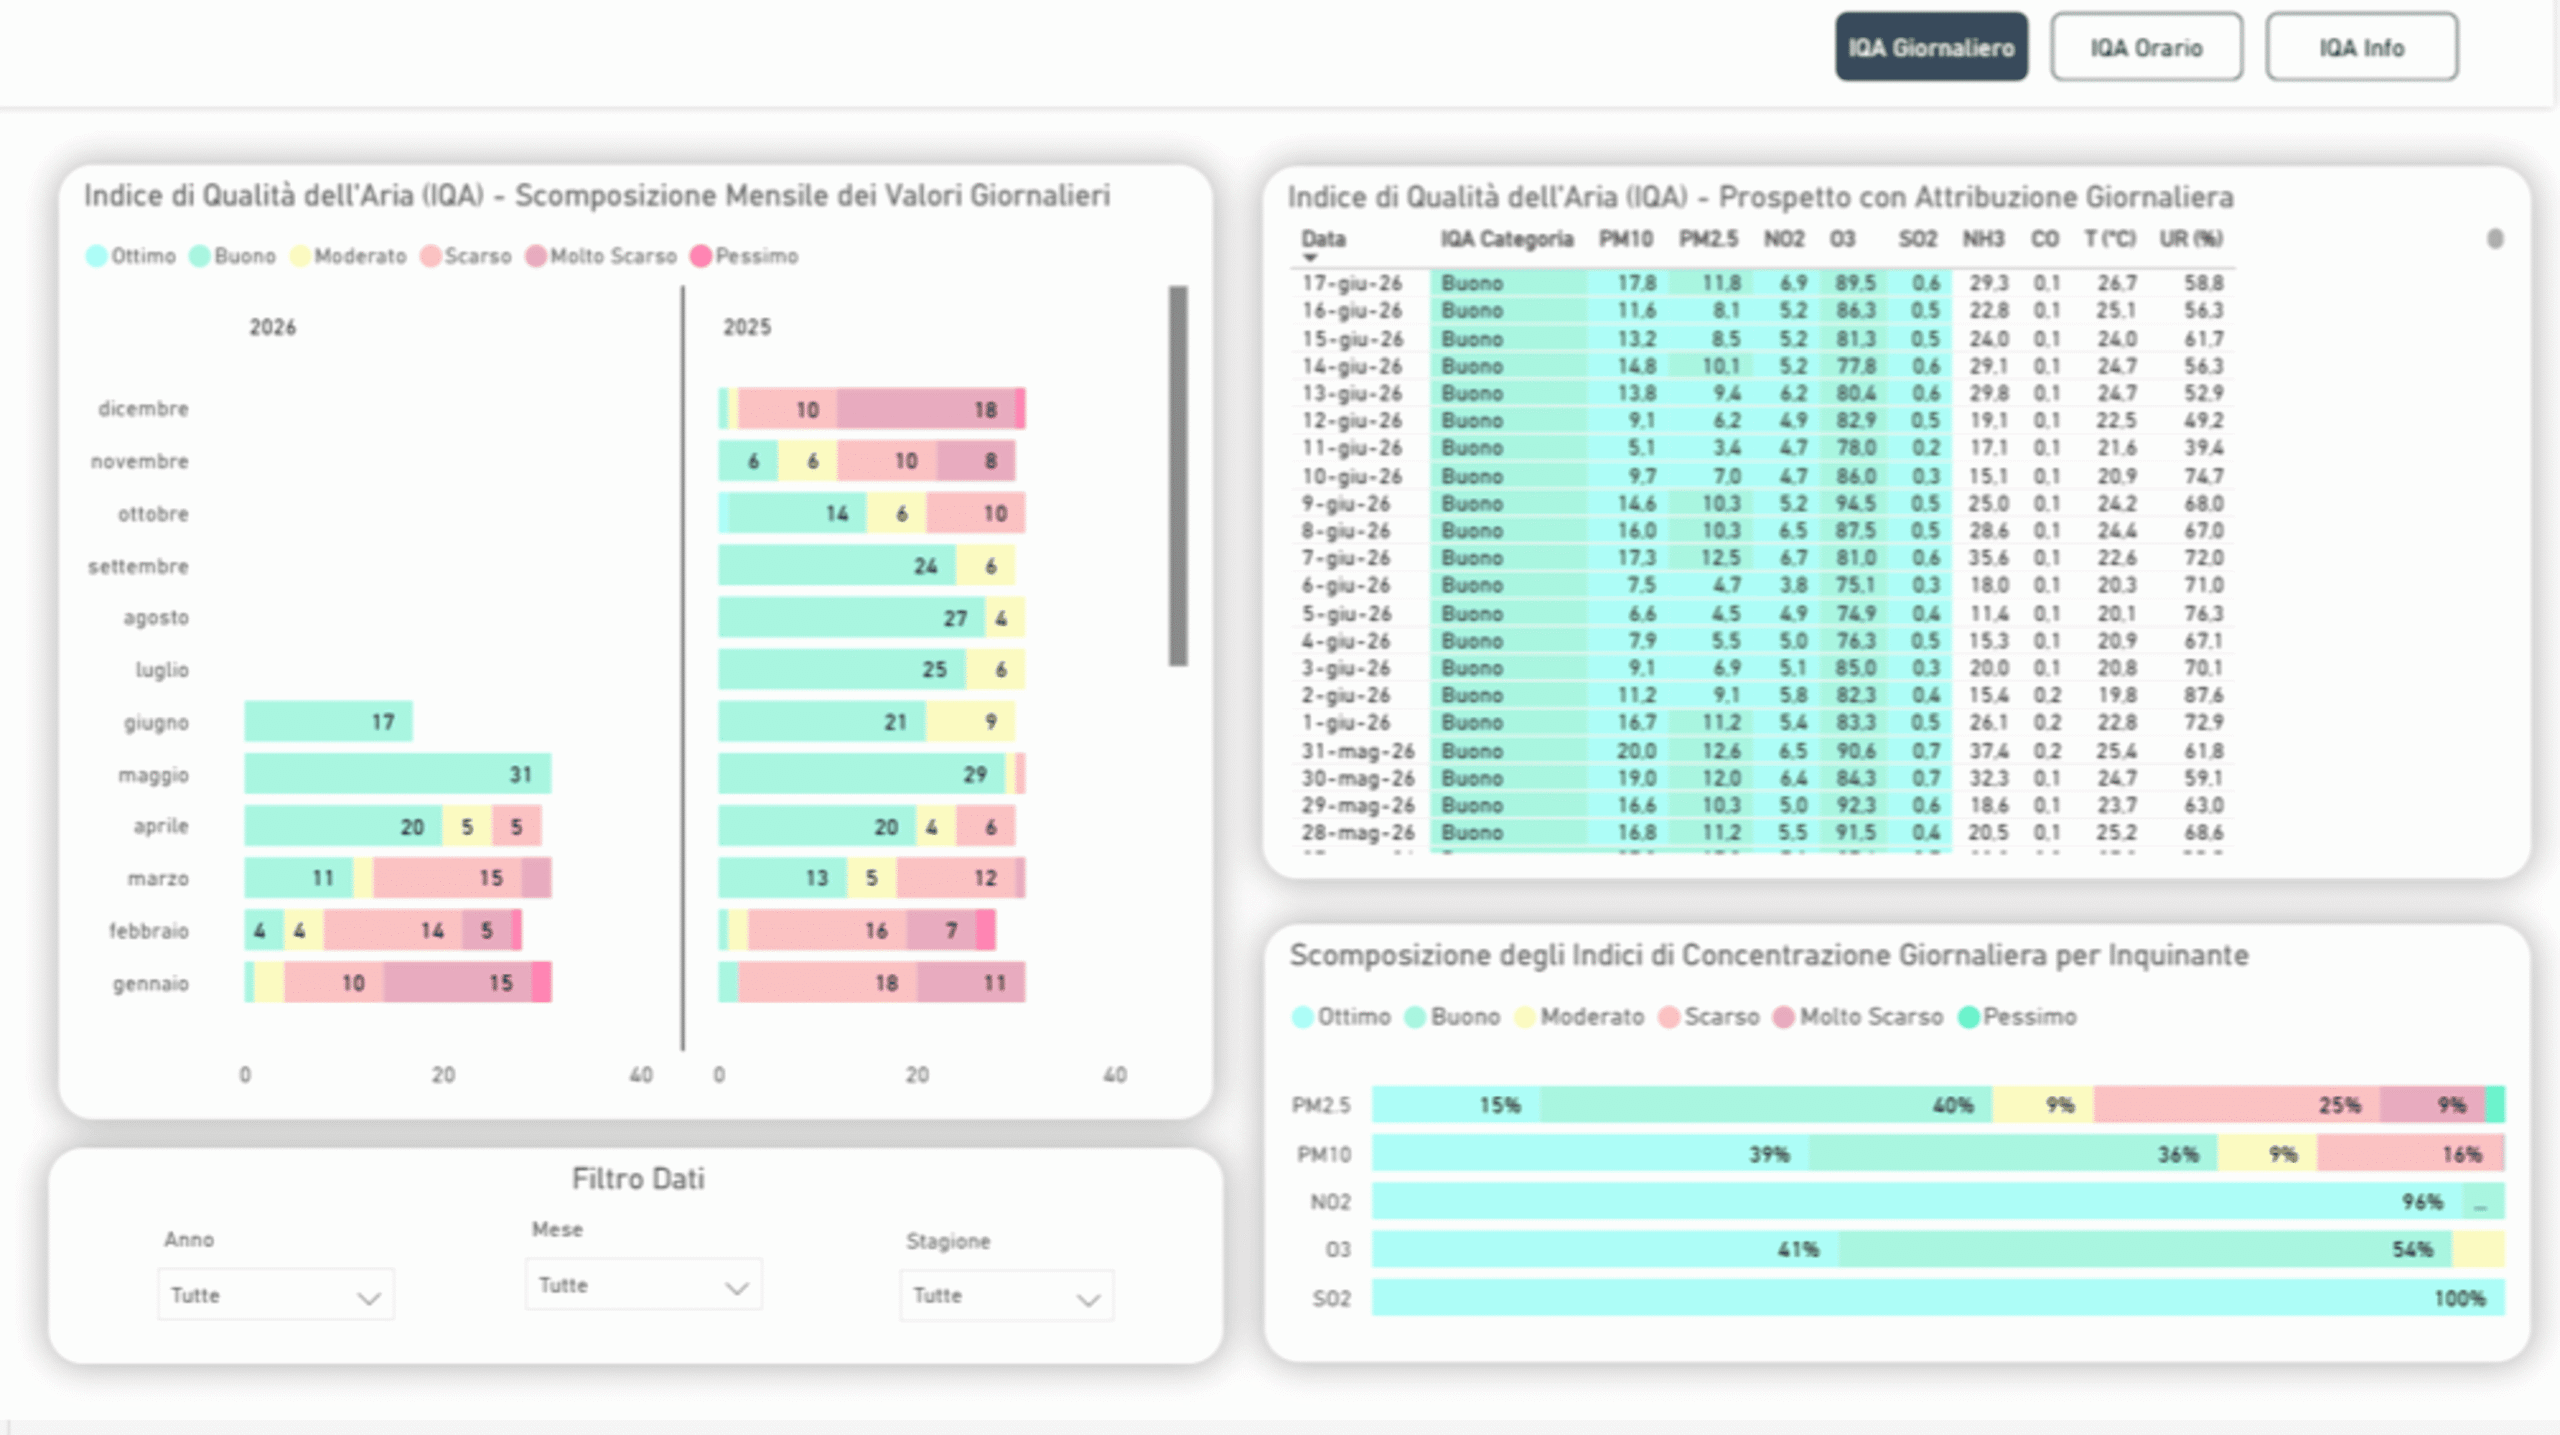
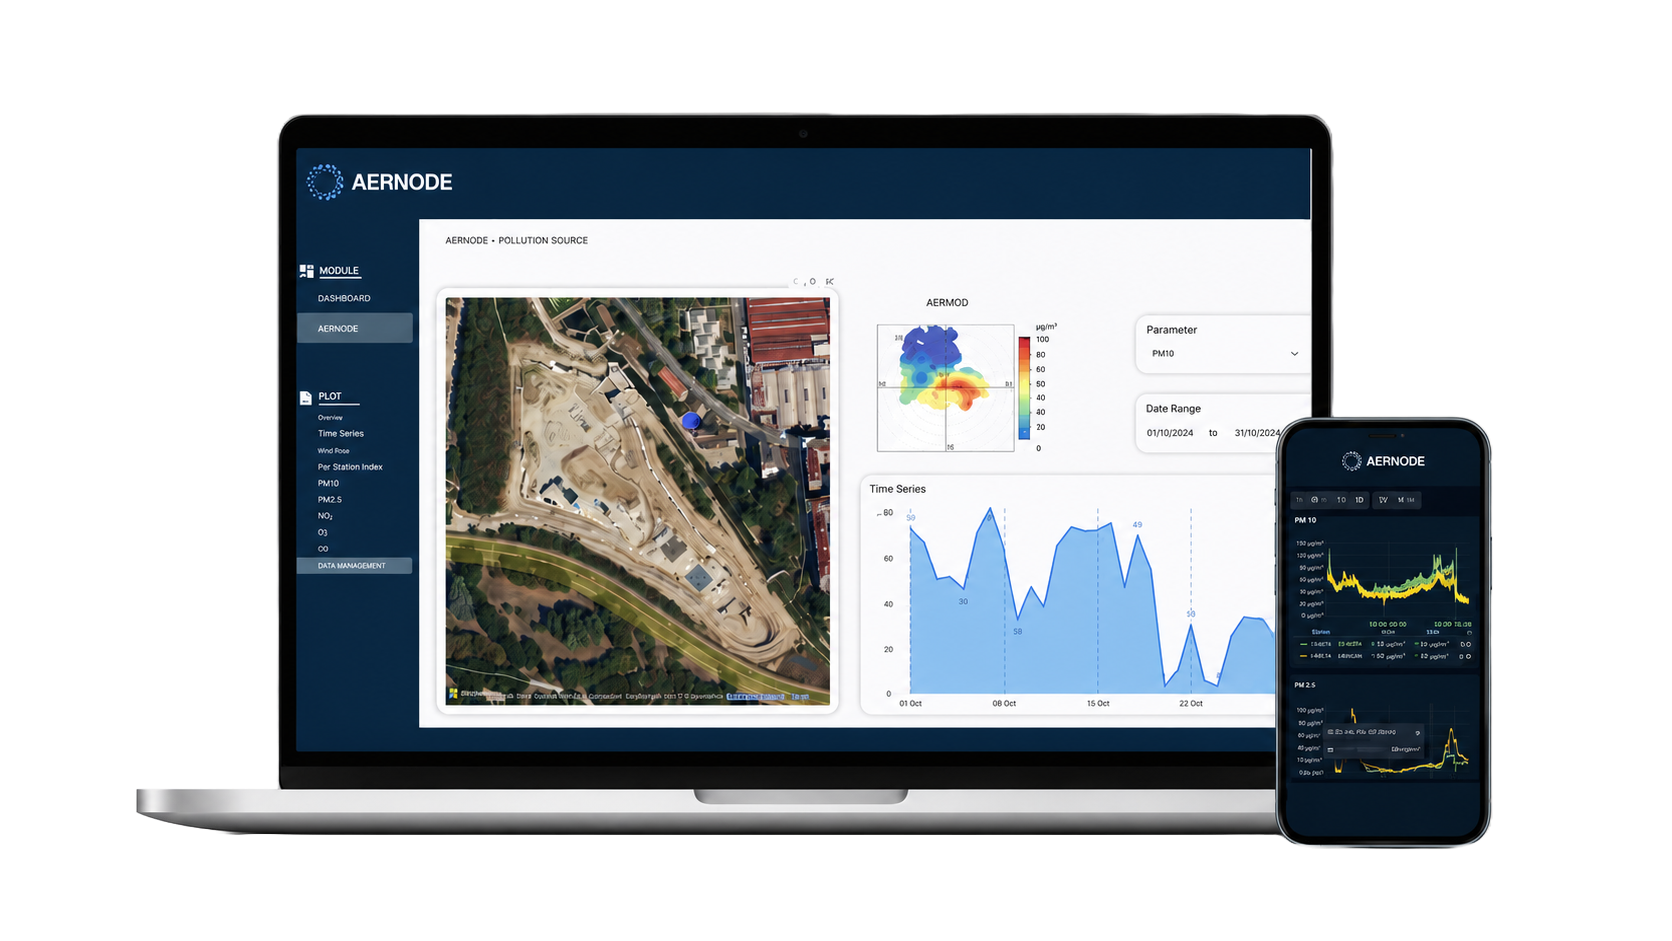
Aernode Reporting Tools transform monitoring data into dashboards, analytics views, automated reports and public-facing outputs for environmental monitoring projects.
Operational Dashboards
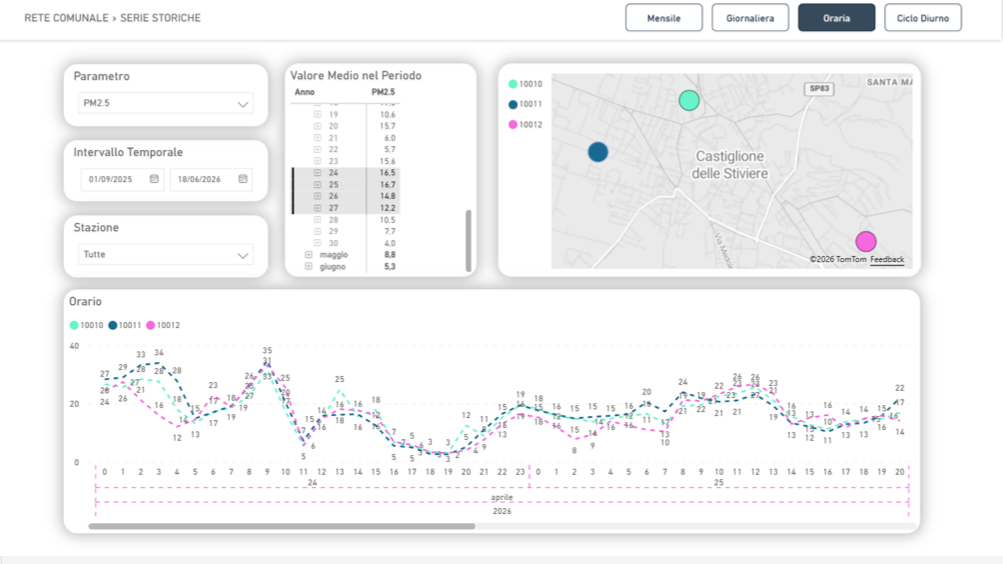
Real-time and historical views for monitoring networks, devices and air quality trends.
Advanced Analytics
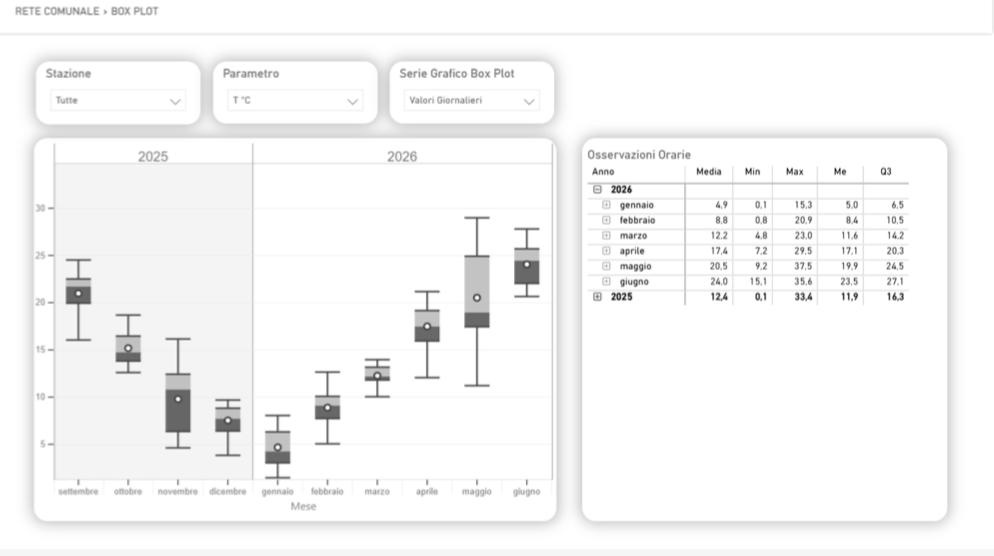
Analytical views for trend analysis, events, cross-parameter review and reporting workflows.
Reports & Alerts
Scheduled reporting and threshold-based notifications for operational and project teams.
Public AQ Portal
Public-facing dashboards and reports for stakeholder communication and transparency.
Reporting tools for dashboards, analysis and communication
Turn validated measurements into operational dashboards, analytical views, automated reports and shared communication outputs.
Dashboards & Visualization
Real-time and historical views for pollutants, devices, sites and projects.
Advanced Analytics
Trend analysis, event review, cross-parameter visualization and custom indicators.
Reports & Alerts
Scheduled reports, threshold notifications and operational summaries.
Access & Sharing
Private workspaces, shared dashboards, snapshots and exported data.
Public AQ Portal
Public-facing dashboards and reporting views for stakeholder communication.
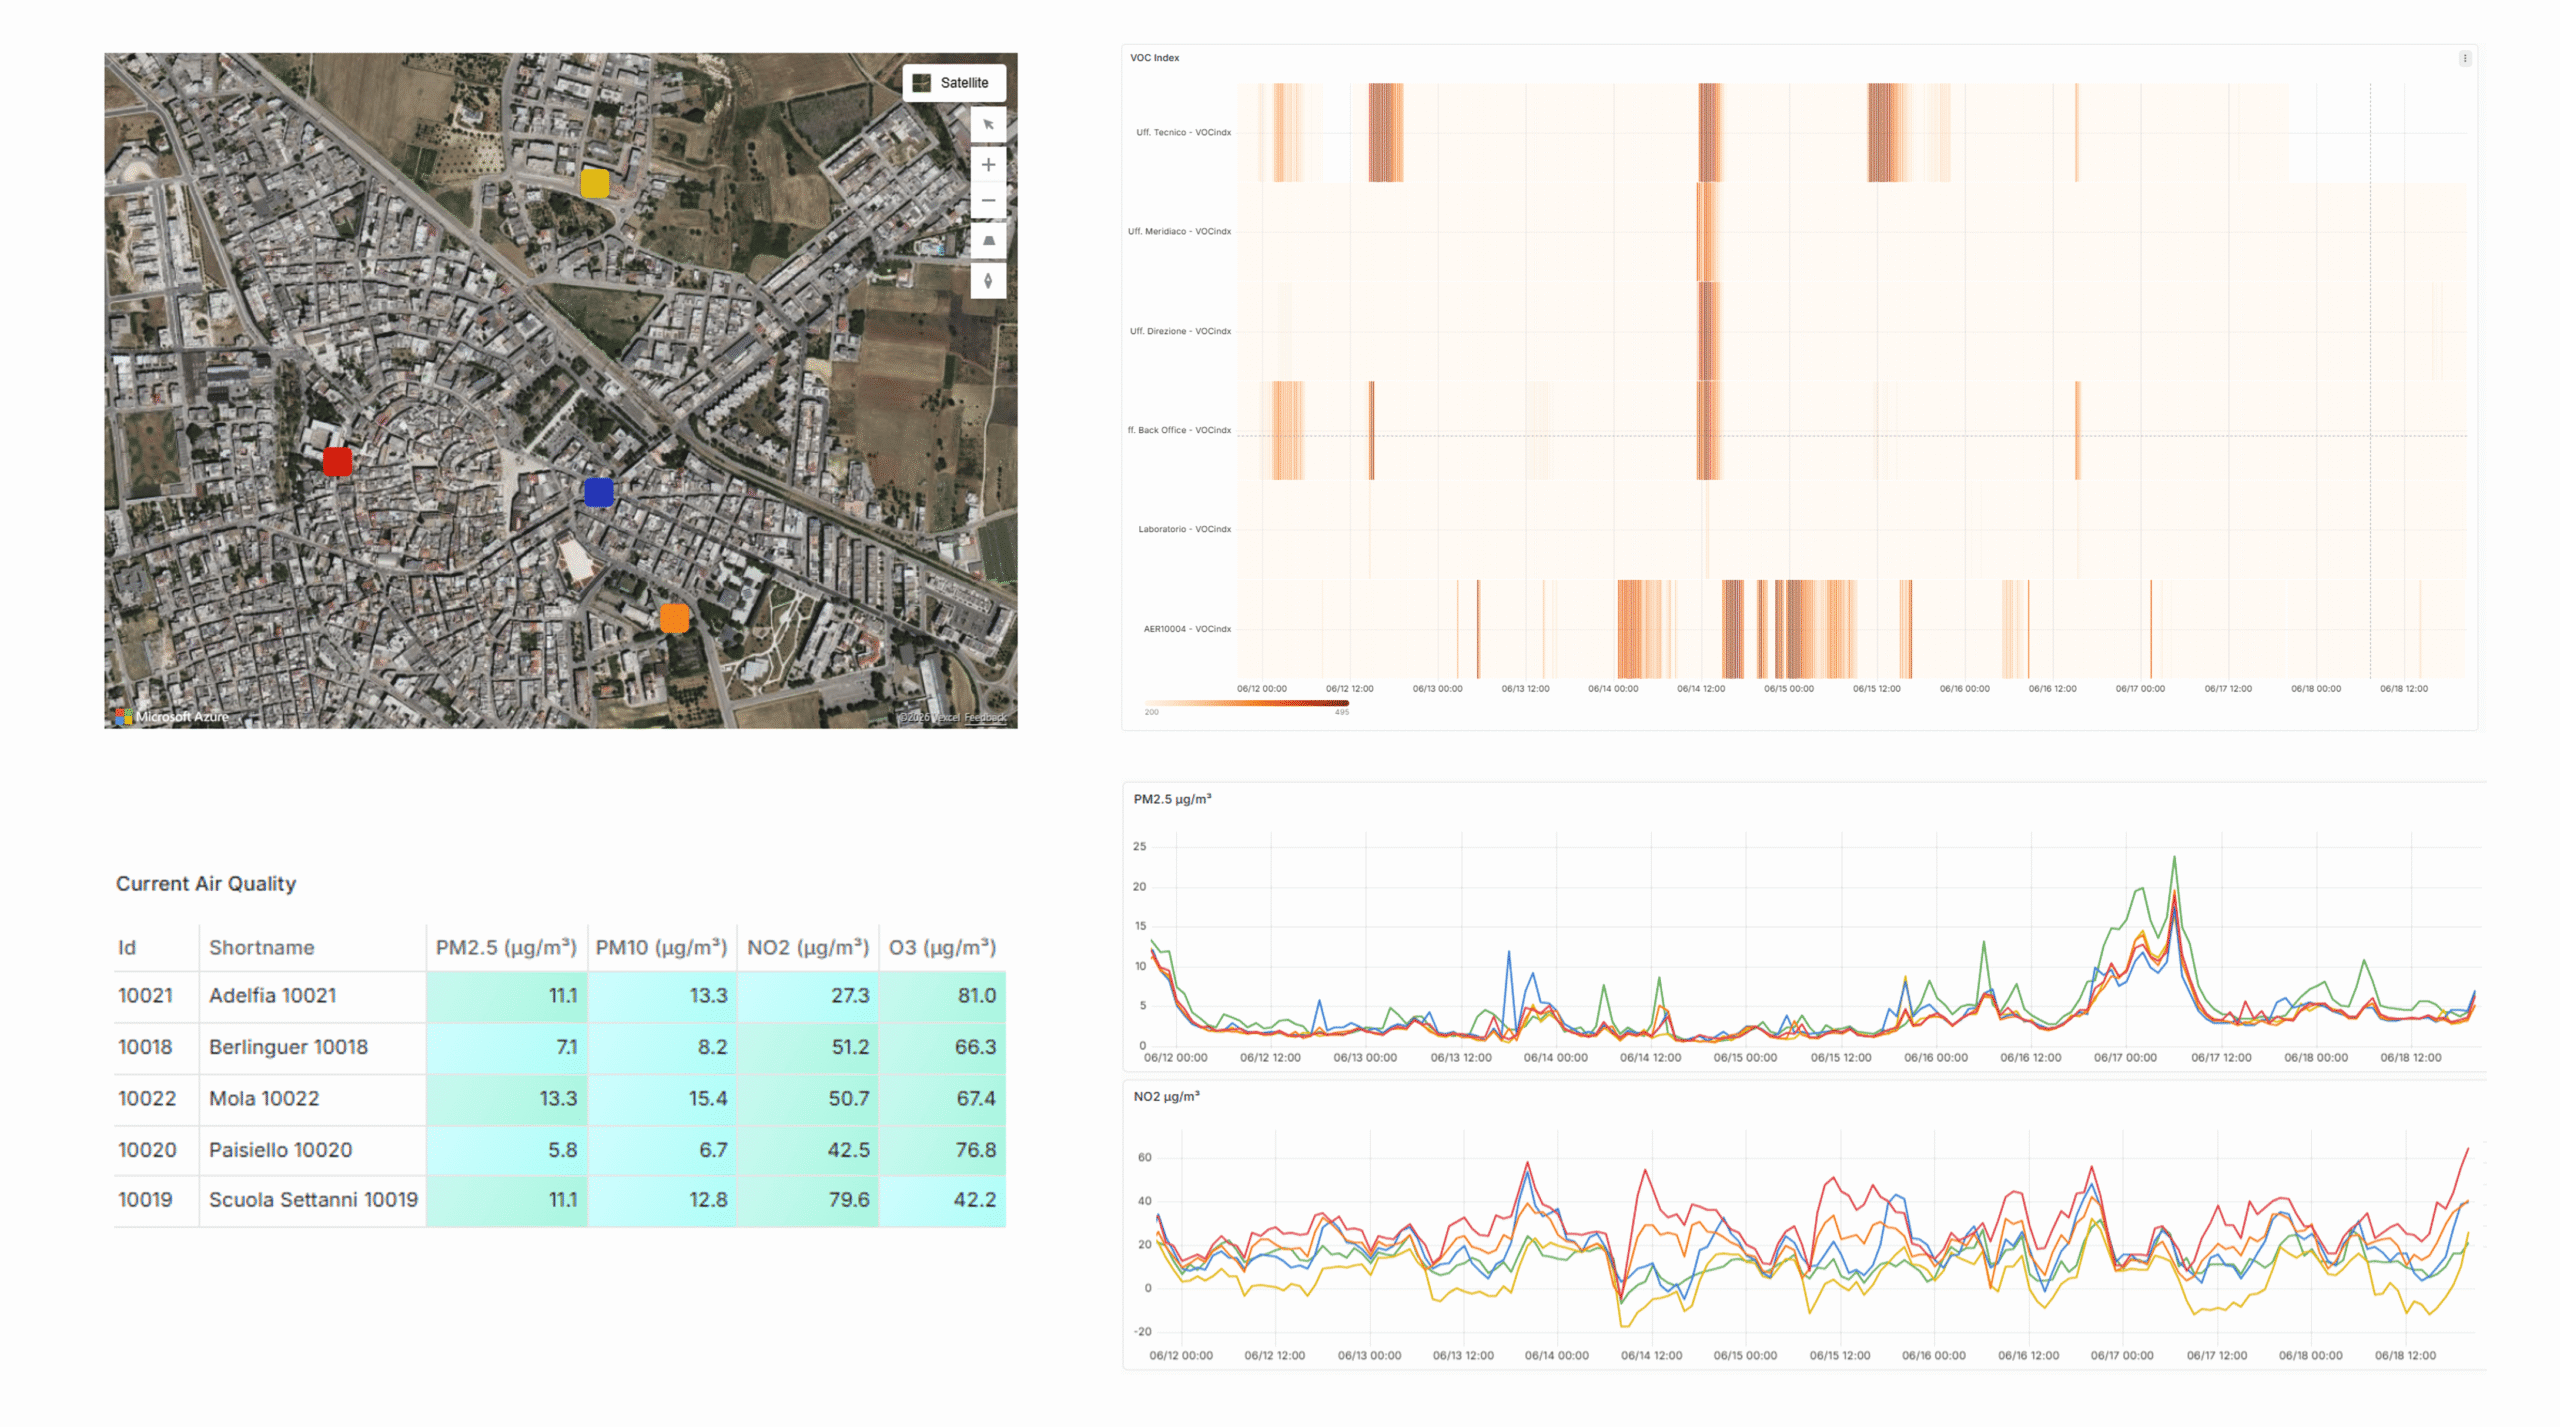
Support daily decisions with clear monitoring views
Use reporting tools to supervise monitoring networks, investigate data trends and share clear information with project teams, clients or stakeholders.
Monitor
Real-time and historical dashboards for network supervision, device review and air quality data monitoring.

Analyze
Analytical views for trends, exceedances, pollutant behavior, event review and cross-parameter analysis.

Communicate
Reports, dashboard snapshots and public-facing views for clients, institutions and project stakeholders.
Frequently asked
questions
Answers on dashboards, environmental analysis, automated reporting and stakeholder communication.
What are Aernode Reporting Tools, and how are they different from Aernode Cloud?
Aernode Reporting Tools are optional add-on environments that turn environmental data managed through Aernode Cloud into dashboards, analyses, reports and communication outputs.
Aernode Cloud provides the underlying data infrastructure and operational device-management layer, while Reporting Tools add deeper visualization, historical analysis, derived indicators, automated reporting and stakeholder-facing outputs according to the needs of the project.
Do I need Reporting Tools to access Aernode measurement data?
No. Aernode Cloud already provides access to operational measurement data and the core functions needed for network supervision and data management.
Reporting Tools are separate optional modules for projects that require more advanced dashboards, historical analysis, scheduled reports, tailored indicators or public-facing communication.
What types of reporting tools are available for Aernode projects?
Aernode reporting can be configured around different project needs. Operational reporting environments focus on live monitoring, time-series visualization, alerts and scheduled operational reports.
Advanced analytics and reporting environments support deeper historical analysis, data modelling, derived indicators, structured reporting and external or public communication.
The appropriate reporting module is selected according to whether the project is primarily operational, analytical or communication-oriented.
Can environmental reports and alerts be generated automatically?
Yes. Reporting configurations can include scheduled reports, PDF outputs and automated alerts based on pollutant thresholds, data conditions or network-operational events.
Report frequency, alert logic, recipients and distribution workflows can be defined according to the project, reducing repetitive manual reporting while keeping the underlying monitoring data available for further review and analysis.
Can external environmental datasets be combined with Aernode measurements?
Yes. Advanced reporting modules can combine Aernode measurements with compatible external datasets when additional context is useful for the project.
This can include meteorological information and environmental datasets such as Copernicus data. External-data integration is configured as part of the reporting setup according to the required sources, analytical objectives and data workflow.
Can Aernode provide public-facing dashboards and portals?
Yes. Aernode Reporting Tools can be configured to provide public-facing dashboards and portals for transparency, institutional communication and stakeholder engagement.
Public views can be kept separate from the operational environment used by project managers and network operators, so selected information can be shared without exposing internal monitoring and management functions.
Can dashboards, indicators and reports be customized for a specific project?
Yes. Aernode Reporting Tools are configurable rather than fixed templates.
Dashboard layouts, filters, derived indicators, analytical views, report structures and connected data sources can be adapted to the monitoring objectives and communication requirements of the project. The scope of customization is defined during project setup according to the selected reporting module.
Make air quality data easier to understand, share and act on
Use dashboards, automated reports and public views to turn monitoring data into clear operational, analytical and communication outputs.