Port areas

Air quality monitoring for ports and terminals

Port environments combine vessel activity, cargo handling, terminal equipment, road traffic and logistics operations within the same area.

Aernode enables distributed, continuous monitoring across terminals, operational zones and port boundaries, providing high-frequency environmental data to compare locations, follow changes over time and review measurements alongside port activity and meteorological conditions.

Continuous port air quality monitoring

Continuous insight for port environmental management

Port environments bring together vessel movements, cargo handling, terminal equipment, road traffic and logistics activities across large and operationally complex areas. Air quality can therefore vary between berths, terminals, access roads, logistics zones and the port perimeter. Continuous distributed monitoring provides additional spatial and temporal information to understand these variations and follow changing conditions over time.

Aernode provides a distributed monitoring layer for day-to-day environmental management, with nodes positioned around relevant operational areas, port boundaries and the port-city interface. Measurements can be reviewed alongside port activity and meteorological conditions to compare locations, investigate changing conditions and evaluate environmental interventions. Where reference air quality stations are already available, distributed monitoring can complement them with greater spatial and operational coverage without replacing regulatory measurements.

Monitoring value

The value of distributed air quality monitoring across port areas

Distributed monitoring adds spatial and operational detail across complex port environments, helping port authorities and operators compare areas, review changing conditions and build a continuous evidence base for day-to-day environmental management.

01

Extend monitoring across the port

Distributed nodes can provide additional measurement points across berths, terminals, logistics areas, access roads and port boundaries, giving greater spatial detail across large and operationally diverse environments.

02

Add operational context to measurements

Air quality data can be reviewed alongside vessel movements, cargo handling, terminal activity, road traffic and meteorological conditions, providing additional context for variations observed at different locations and times.

03

Investigate changing conditions

Continuous time-series data helps identify when and where monitored parameters change, allowing operators to review specific periods, compare nearby monitoring locations and determine where further investigation may be useful.

04

Evaluate environmental interventions

Consistent measurements can support before-and-after comparison of measures such as terminal electrification, traffic management, operational changes or other initiatives intended to improve environmental conditions within the port.

05

Strengthen environmental data and reporting

Distributed measurements can be combined with meteorological, operational and other environmental data and, where available, complement reference monitoring with additional spatial and temporal information for analysis, reporting and stakeholder communication.

Monitoring network deployment

A monitoring network designed around port operations and boundaries

Each deployment is configured around the structure of the port, relevant operational activities, prevailing meteorological conditions and the areas where additional environmental information is most useful for day-to-day monitoring and analysis.
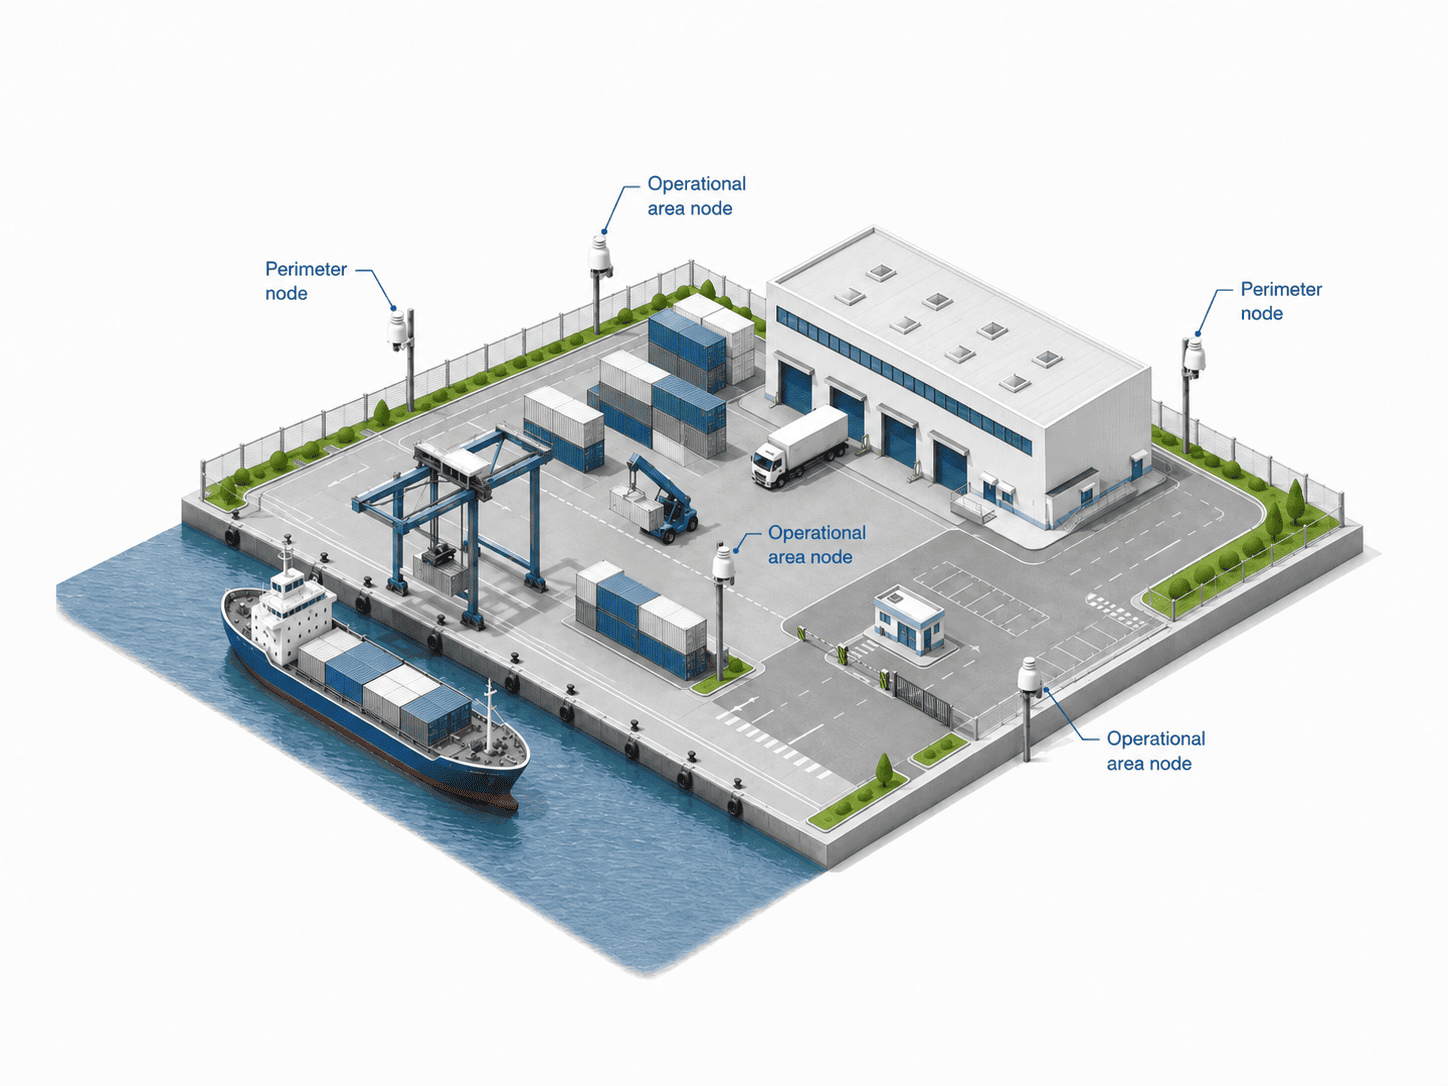
Aernode distributed air quality monitoring network across a port and terminal area
01

Define the monitoring objectives

Identify the environmental questions the network should help address, from comparing different port areas to following conditions around specific operations, boundaries or the interface between the port and surrounding communities.

02

Configure and position the network

Select the relevant parameters and position monitoring nodes across berths, terminals, cargo and logistics areas, access roads or perimeter locations according to operational priorities, prevailing winds and the comparisons required.

03

Connect environmental and operational data

Combine continuous measurements with meteorological information, dashboards and relevant operational data to compare locations and time periods. Where existing monitoring systems are available, distributed measurements can add further spatial and operational context.

Key environmental parameters

Parameters commonly monitored across port environments

Parameter Why it matters in ports and terminal environments
PM₂.₅ / PM₁₀ Particulate matter
Particulate matter can vary with vessel activity, cargo and material handling, road traffic, terminal equipment and other local or regional sources. Distributed monitoring helps compare conditions across terminals, operational areas and port boundaries and follow variations over time.
NO₂ Nitrogen dioxide
Nitrogen dioxide is relevant in environments influenced by combustion sources including vessels, heavy-duty vehicles and terminal equipment. Measurements from multiple locations help review spatial and temporal variations alongside operational activity and meteorological conditions.
SO₂ Sulphur dioxide
Sulphur dioxide can be relevant in maritime environments due to fuel combustion and other local or regional influences. Continuous monitoring can provide additional information on concentration variations around berths, terminals and the wider port area.
O₃ Ozone
Ozone is a secondary pollutant influenced by atmospheric chemistry, meteorological conditions and regional air masses. Continuous monitoring provides broader ambient air quality context across port and surrounding areas and helps characterise diurnal and seasonal concentration patterns.
CO Carbon monoxide
Carbon monoxide provides an additional indicator of combustion-related conditions around selected port activities. Continuous measurements can be compared between locations and operating periods to provide further context for observed environmental variations.
dB Environmental noise
Vessel operations, cargo handling, terminal equipment and road traffic can contribute to changing noise conditions around ports. Environmental noise monitoring can complement air quality data, particularly at port boundaries and the port-city interface.
Meteo Meteorological parameters
Wind speed and direction, temperature, humidity and other meteorological variables provide essential context for interpreting measurements across large port areas and comparing conditions observed at different monitoring locations.

Monitoring configurations are project-specific; particulate matter, NO₂, SO₂, O₃, CO, environmental noise and meteorological parameters can be selected according to port activities, site characteristics and monitoring objectives.

Solution stack

Explore the Aernode Components

Aernode air quality monitor
Field monitoring hardware

Aernode Monitors

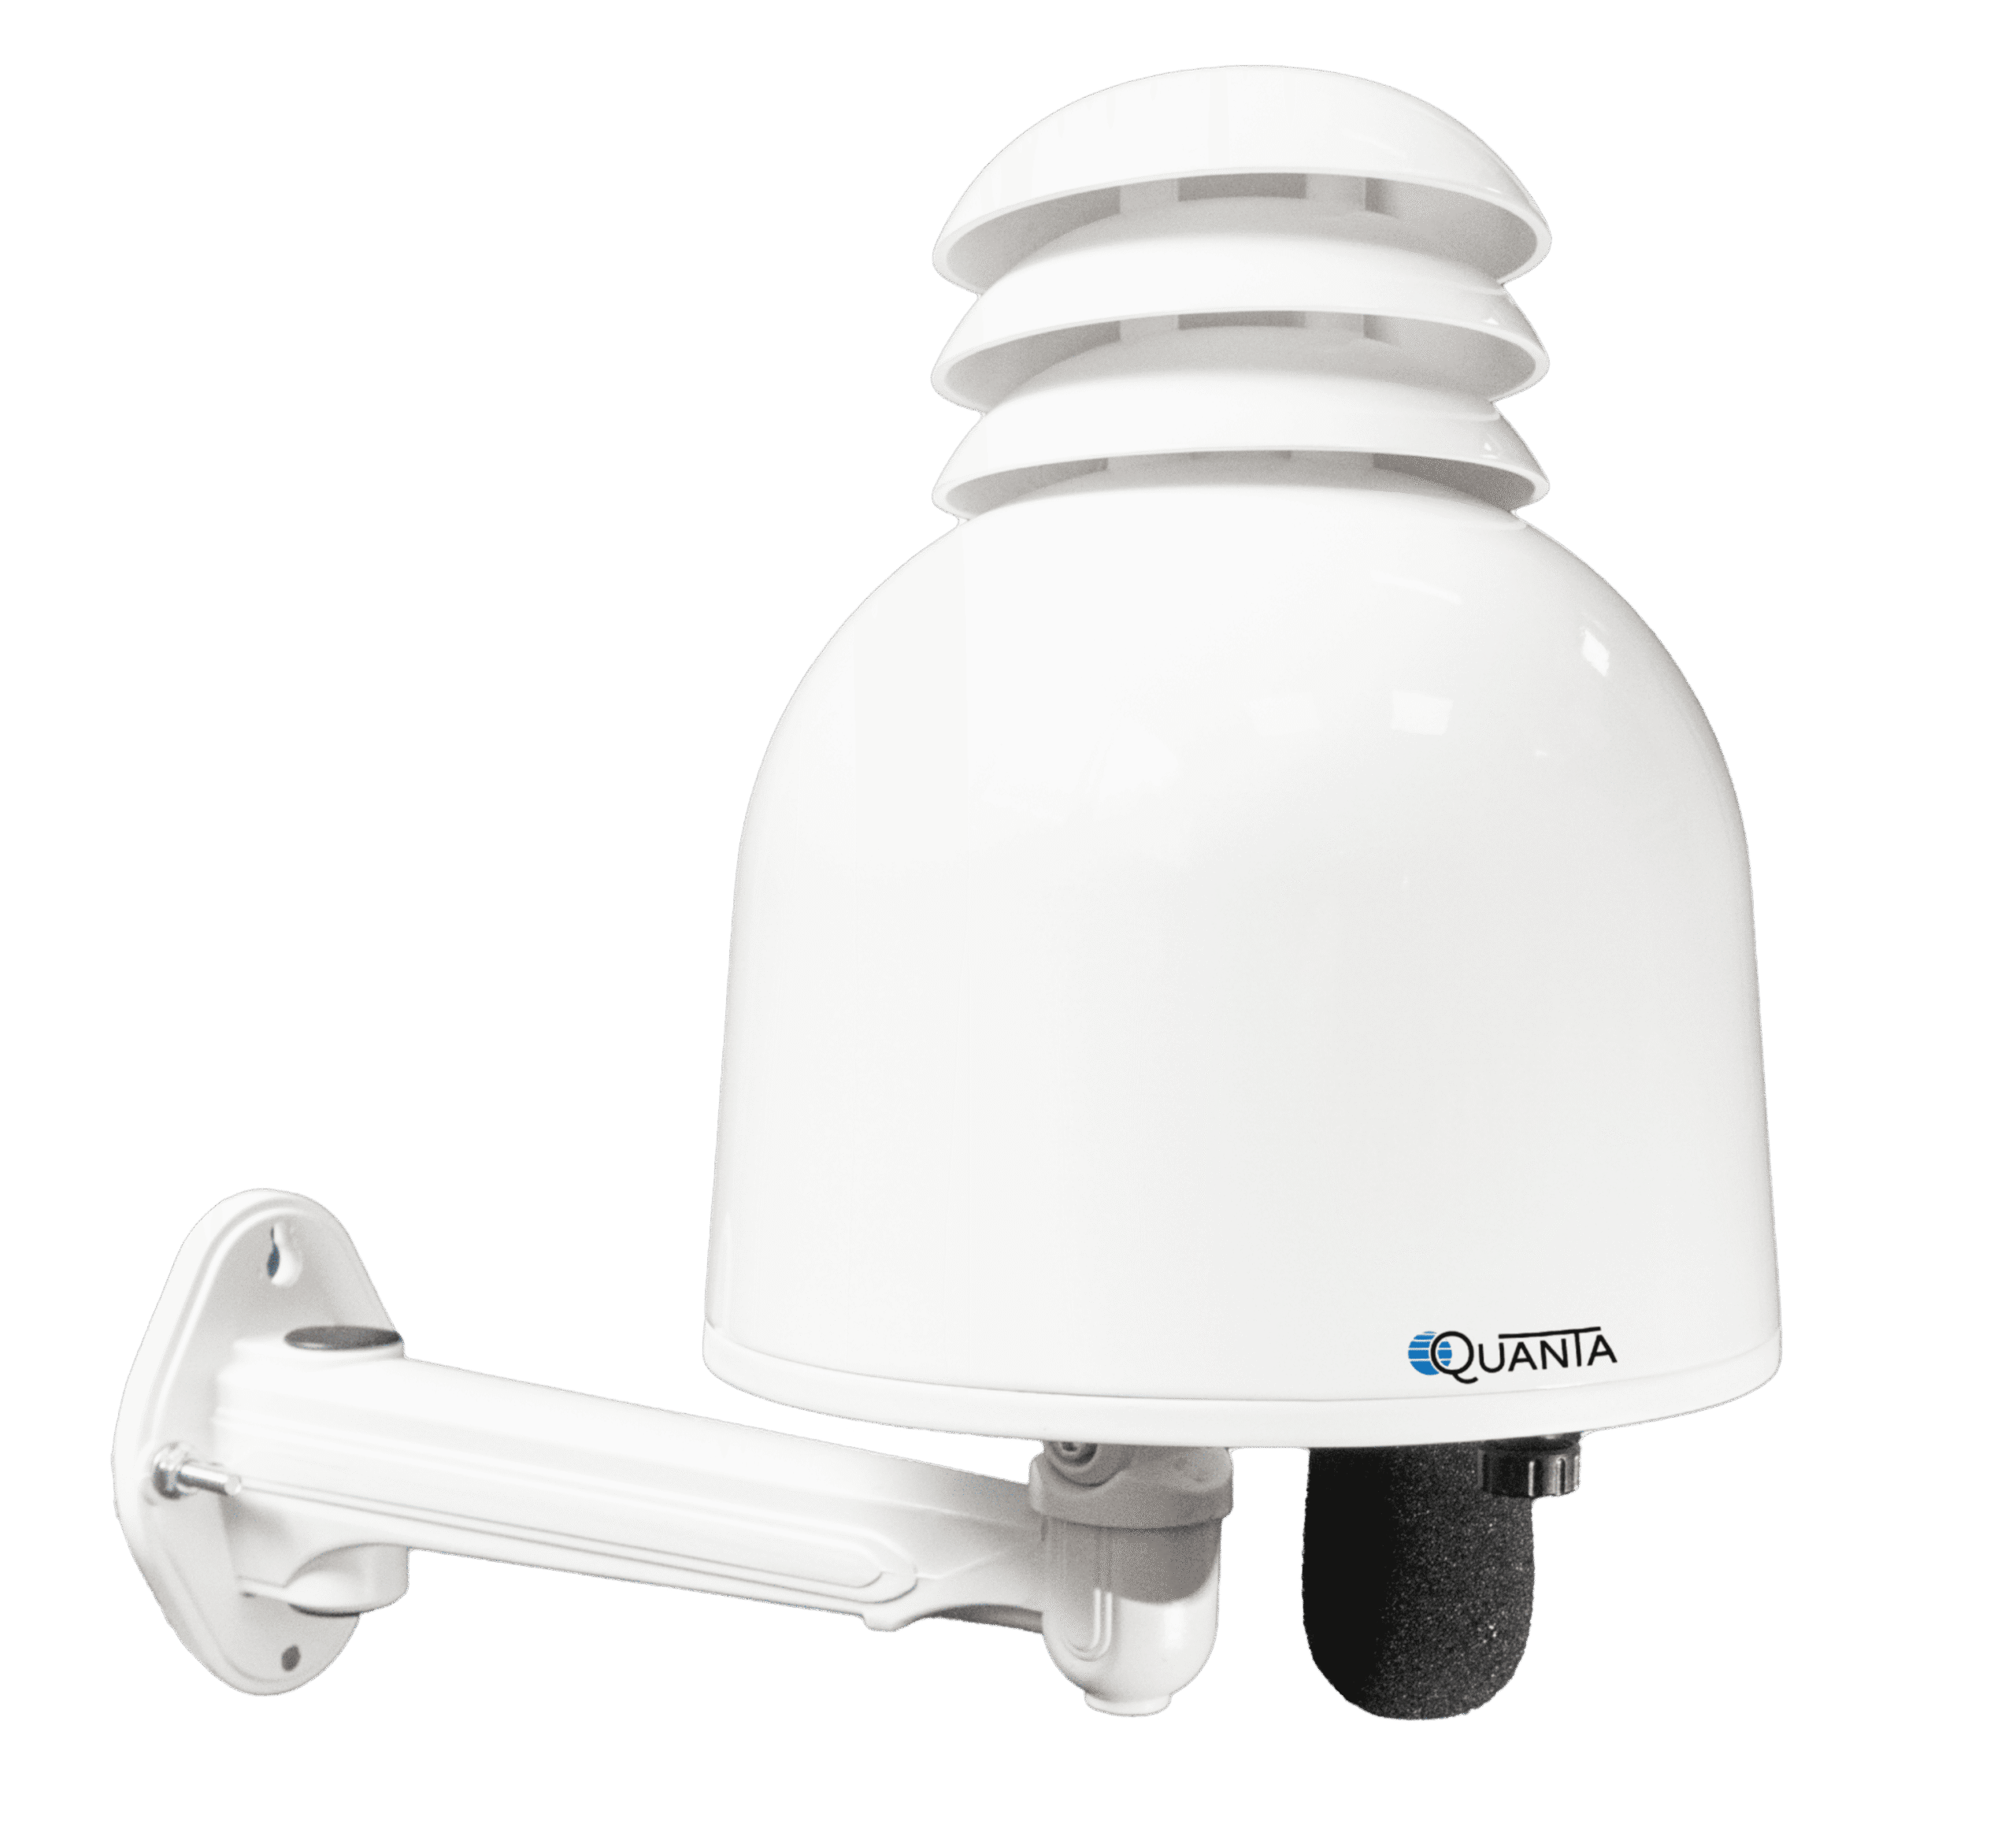
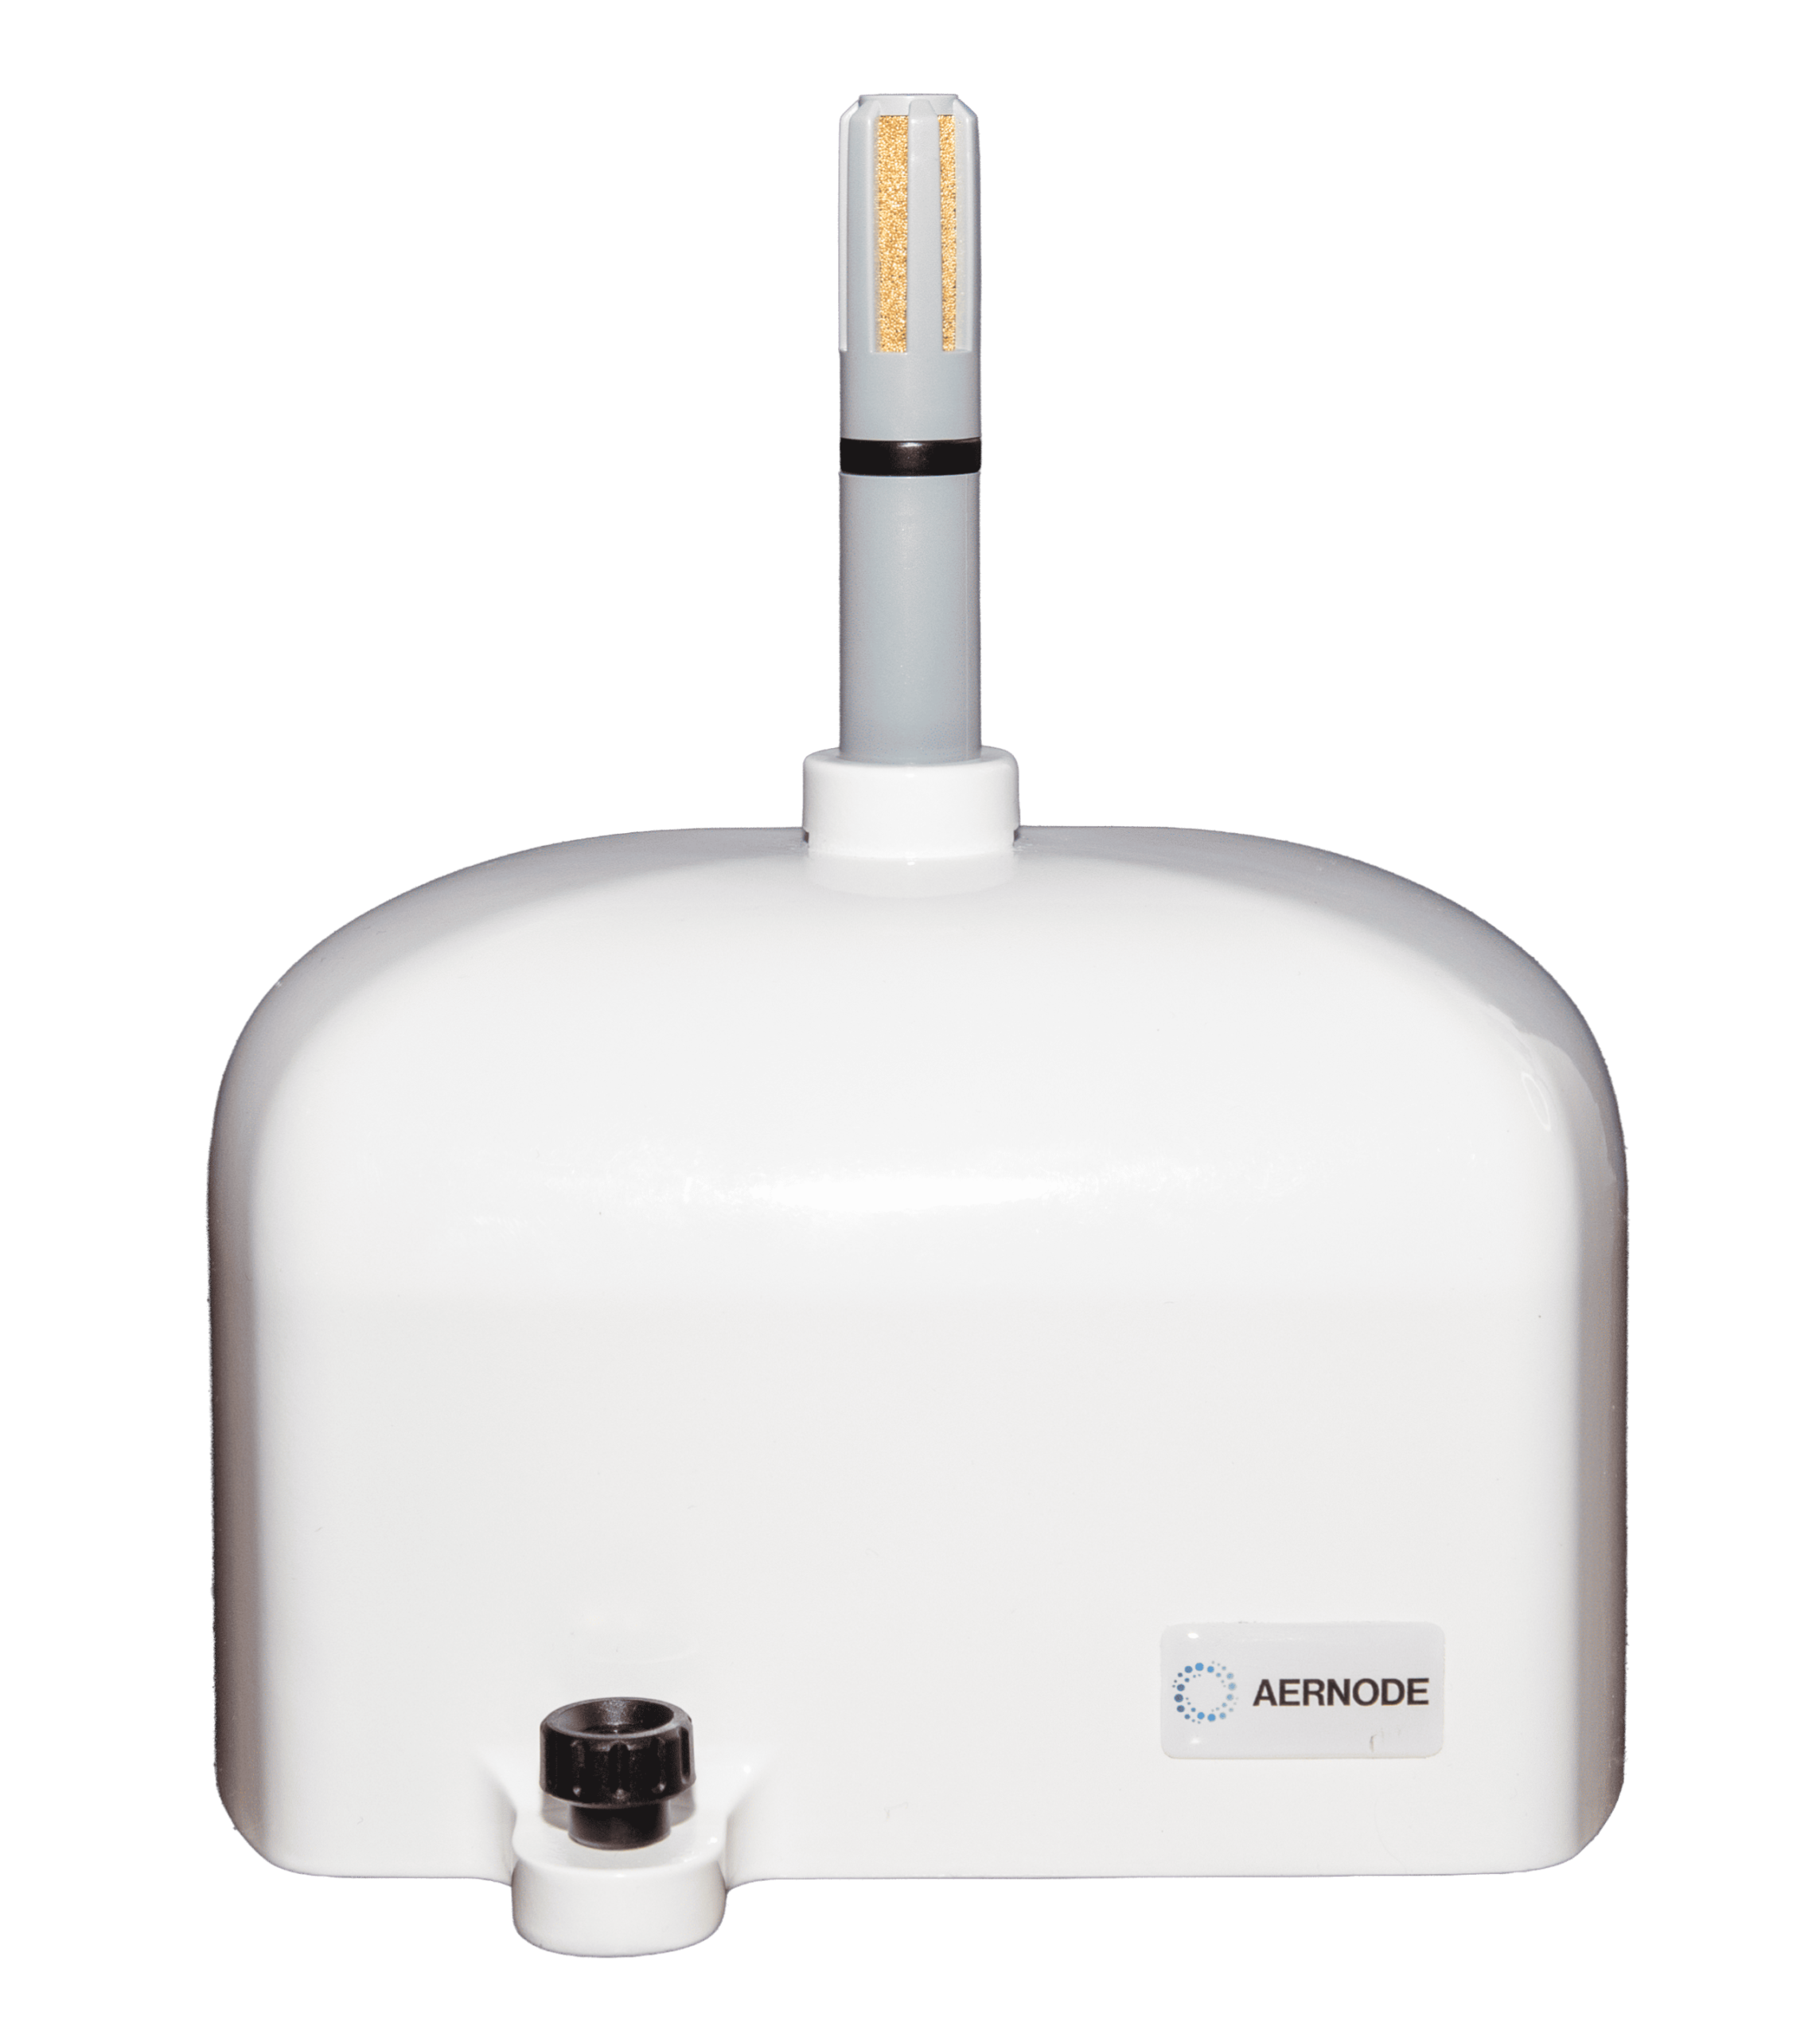
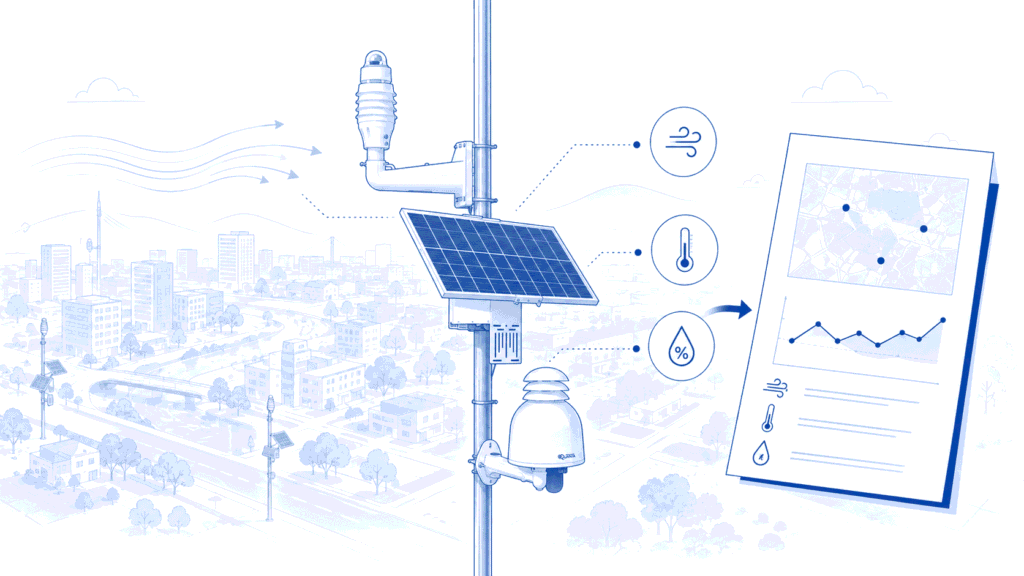
Configurable outdoor stations for continuous measurement of particulate matter, gaseous pollutants and environmental conditions across distributed monitoring networks.

  • Site-specific pollutant configurations
  • Continuous outdoor data acquisition
  • Designed for single-site and multi-node networks

Explore Aernode Monitors
Aernode Cloud
Data infrastructure

Aernode Cloud

A central environment for device supervision, data storage, post-processing and secure access to current and historical monitoring information.

  • Remote network and device management
  • Historical records and data continuity
  • Authenticated integration through APIs
Explore Aernode Cloud
Aernode Sensor Kit
Modular sensing assemblies

Sensor Kits

Preconfigured sensing assemblies that simplify pollutant selection, field servicing and configuration updates throughout the operating life of the network.

  • Modular pollutant combinations
  • Efficient field replacement
  • Configuration tailored to project requirements
Explore Sensor Kits
Aernode reporting tools
Dashboards and reporting outputs

Reporting Tools

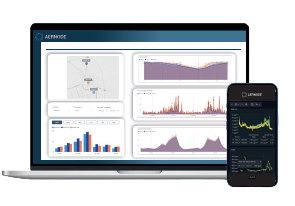
Digital environments for current conditions, historical analysis, automated outputs and communication with internal teams or external stakeholders.

  • Real-time and historical dashboards
  • Threshold alerts and scheduled reports
  • Private and stakeholder-facing environments
Explore Reporting Tools
Aernode deployment accessories
Deployment accessories

Accessories

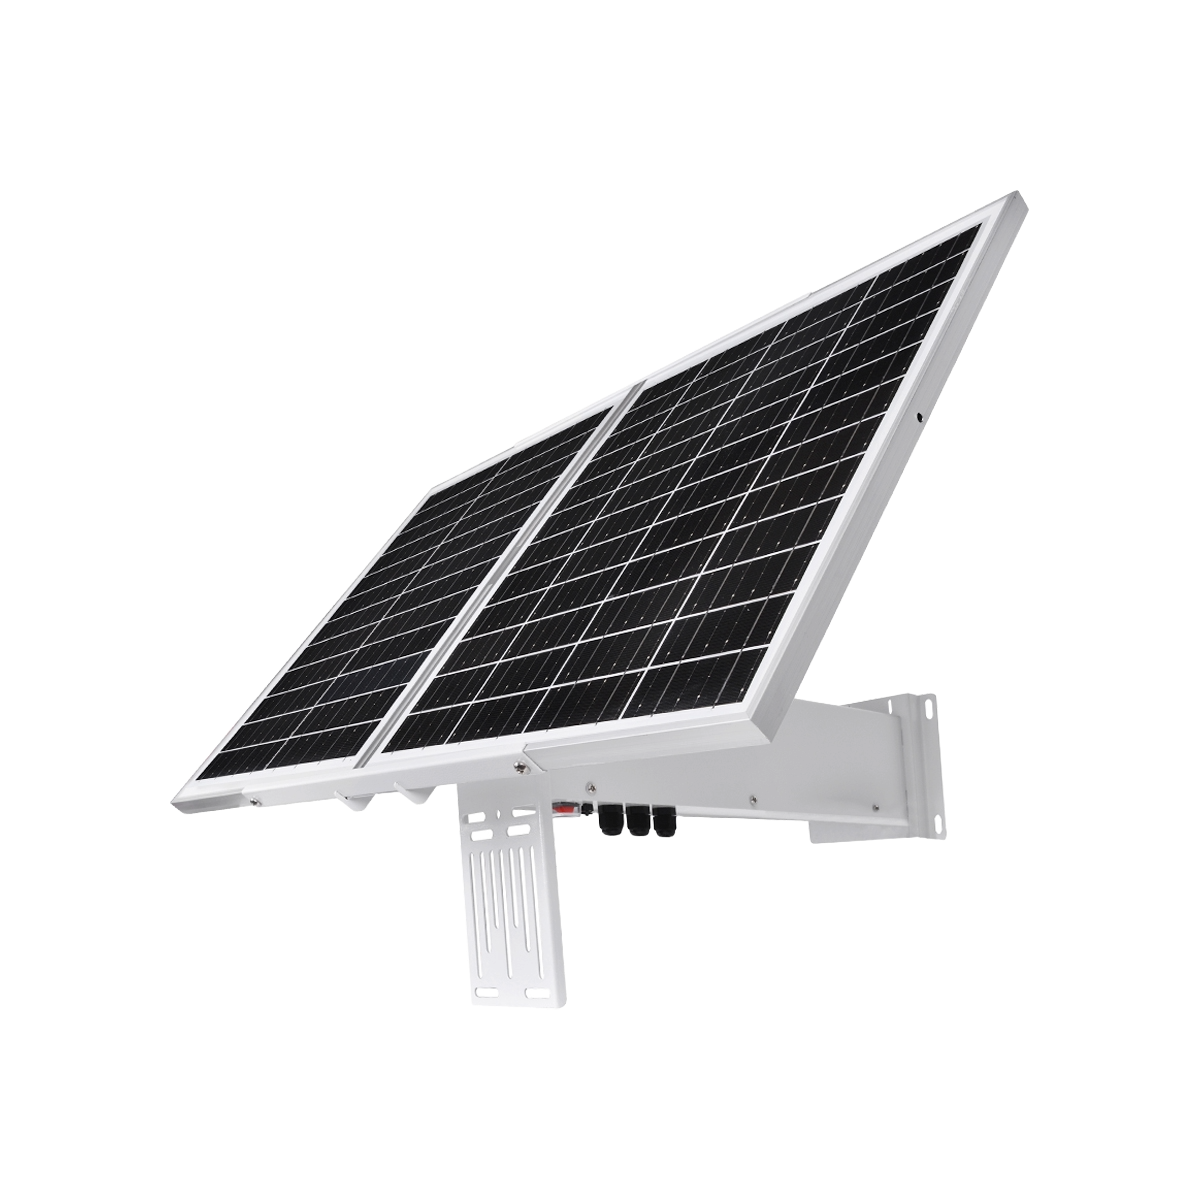
Power, meteorological, mounting and connectivity options for fixed-site, perimeter and off-grid monitoring configurations.

  • Weather stations and anemometers
  • Solar power and autonomous deployment options
  • Mounting and connectivity accessories
Explore Accessories
Port monitoring configuration

Plan a monitoring network for your port or terminal

Define the right environmental parameters, monitoring locations, connectivity and reporting workflow for continuous monitoring across berths, terminals, logistics areas, access roads and port boundaries.