A port is a spatial air-quality monitoring problem
Ports are difficult to characterise with only a few air-quality measurement points. A single port can combine vessel berths, cargo handling, non-road machinery, truck and rail traffic, neighbouring industry and residential areas across a large footprint. Activity shifts by hour, berth and terminal, while wind continually changes the relationship between sources and receptors.
A well-run station can still answer only the question represented by its location. A point downwind of a berth in one wind sector may be crosswind or upwind later; a monitor near a gate may capture road influence but say little about a residential area on the opposite side of the harbour. Port air quality is therefore as much a question of representativeness as measurement accuracy.
European evidence shows why this matters. The European Environment Agency’s 2025 review of air quality around ports and airports found large differences in monitoring coverage around major ports. Only five of 22 analysed ports had at least one NO₂ sampling point downwind of the port more than 25% of the time; in the 2023 spatial analysis, annual mean NO₂ was higher in every studied port area than in its surrounding region. Those findings do not attribute every concentration to port activity, but they show how easily a sparse or poorly positioned network can miss important spatial differences.
That is the practical case for a broader monitoring layer in ports. Its value is not simply that more compact instruments can be deployed; it is that additional measurement points can answer questions that a few fixed points cannot answer on their own. The design question is not “how many sensors should the port install?” but “what part of the environmental question must each measurement represent?”
Why the new EU framework makes spatial coverage more important
The recast Ambient Air Quality Directive — Directive (EU) 2024/2881 matters because it makes this spatial logic more explicit. Three changes are especially relevant to port monitoring.
| WHAT CHANGES IN THE EU FRAMEWORK | PRACTICAL CONSEQUENCES FOR A PORT MONITORING STRATEGY |
|---|---|
| Ports can be relevant to hotspot assessment | Ports are explicitly listed among heavy-pollution sources that can strongly influence an air-pollution hotspot. This does not classify every port as a hotspot; it means port-influenced locations may require targeted assessment where population-relevant concentrations are high. |
| Network design must be supported by spatial evidence | Monitoring-network design and periodic review must be supported at least by modelling applications or indicative measurements. The practical question is not only where fixed points exist, but what they represent and where information is missing. |
| Port-source assessment uses source–receptor logic | When assessing port contributions, Annex IV uses downwind residential and upwind/background logic. This makes source, receptor and prevailing-wind relationships part of the formal siting question. |
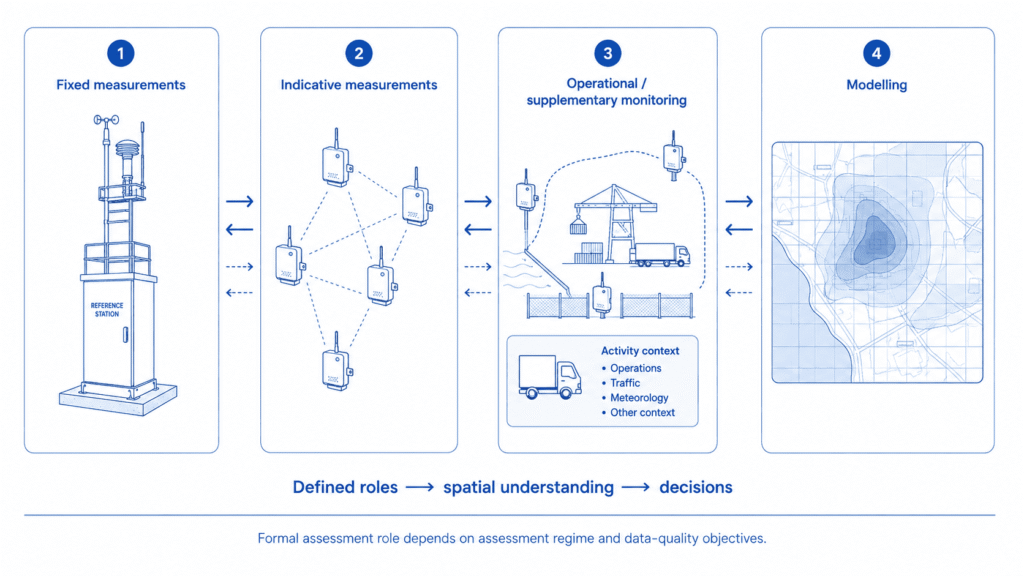
The practical consequence is a more explicit need to understand what the fixed network represents, where its spatial limits are, and which complementary methods can close those gaps. Fixed measurements remain the formal assessment anchors where the applicable regime requires them; indicative measurements and modelling add different kinds of spatial evidence.
What indicative monitoring actually means
Under Directive (EU) 2024/2881, “indicative measurements” are measurements taken at regular intervals during a calendar year or by random sampling against data-quality objectives that are less strict than those for fixed measurements. The broader distinction between indicative and supplementary monitoring roles matters here: indicative describes a measurement category and data-quality role, not a sensor category.
A compact continuous monitor can be part of an indicative programme, but it does not qualify automatically because it is lower cost, digital or used in a dense network. Formal indicative use depends on the pollutant, measurement method, demonstrated uncertainty, data coverage, siting, QA/QC and the competent-authority framework.
| MEASUREMENT LAYER | PRIMARY ROLE | TYPICAL PORT USE |
|---|---|---|
| Fixed measurements | Measurements at constant locations for at least one calendar year, meeting the stricter fixed-measurement data-quality objectives. | Formal assessment anchor where required; may represent hotspot, transport, industrial or background conditions. |
| Indicative measurements | A formal AAQD measurement category with less stringent data-quality objectives than fixed measurements. | Adds spatial evidence and can support assessment, network design or interpretation when the applicable performance requirements are demonstrated. |
| Operational / supplementary monitoring | A project-defined monitoring role rather than a separate AAQD assessment category. | High-frequency comparison of berths, terminals, roads, boundaries and other operational locations; it becomes formal indicative monitoring only when the relevant requirements are met. |
| Modelling | A formal assessment method used to interpret concentrations geographically and determine spatial representativeness. | Connects point measurements into a wider concentration field and helps identify areas not resolved by the monitoring network. |
The European Commission’s assessment guidance reflects this layered approach: the assessment regime determines how fixed measurements, indicative measurements, modelling and other methods are combined. For a port, the useful principle is to give each layer a specific job rather than treating every instrument as interchangeable.
What this means for a port authority
The formal duties in the Directive sit with Member States and competent authorities. A port authority does not automatically become the statutory air-quality network operator. It can, however, contribute information the authority network may not contain: terminal access, site geometry, vessel and cargo activity, internal road patterns, operational schedules, environmental records and detailed knowledge of nearby receptors.
The useful port-level question is therefore not “what network does the Directive require us to buy?” but “where can the port add information that makes the overall assessment and environmental-management picture more complete?” Before adding measurements, confirm:
- What does the existing competent-authority network represent, and which parts of the port-city interface are already covered?
- Where are the spatial or wind-sector gaps that make a fixed point difficult to interpret?
- Which questions require formal indicative measurements, and which only require supplementary operational monitoring?
- Which operational and meteorological records are available to interpret concentration changes?
- Where would additional measurements materially improve modelling, spatial representativeness or the decision to add a higher-quality point?
This avoids two common errors: deploying a dense network with no defined analytical purpose, and asking an operational node to answer a formal assessment question for which it was never specified. The strongest port network is not necessarily the densest one; it is the one in which every measurement point has a defined role.
How to design the network around the decision
Once the roles are clear, network siting, density and deployment become a practical sequence. Start from the decision the data must support, then work outward from the existing assessment network rather than from a hardware list.
Step 1 — Define the monitoring objective and measurement status
State the question before selecting equipment. Is the programme intended to support formal indicative assessment, spatial representativeness, modelling, operational oversight, event investigation or community reporting? If several objectives coexist, separate the station roles. The closer a dataset is to formal assessment, the more explicit the requirements for validation, uncertainty, coverage, traceability, siting and QA/QC.
Step 2 — Start from the existing fixed monitoring network
Map the competent authority’s fixed sampling points before adding new measurements. Record what each point is intended to represent, its pollutant set, the wind sectors and receptor areas it can meaningfully describe, and where the port-city interface remains unresolved. A new node should close a defined information gap, not simply occupy an easy installation location.
The current EU framework also formalises spatial representativeness. Commission Implementing Decision (EU) 2026/1208 sets technical rules for modelling and for determining the spatial representativeness of sampling points. For a port authority, the practical question is not only where a station sits, but what area and conditions its data can reasonably represent.
Step 3 — Map sources, receptors and meteorology
Treat the port as a source–receptor system. Relevant source areas can include vessel berths, harbour craft, cargo-handling equipment, internal roads, gates, rail, dry-bulk handling, liquid-bulk operations and neighbouring industry. Receptors can include residential areas, offices, public spaces and other locations relevant to population exposure or environmental management.
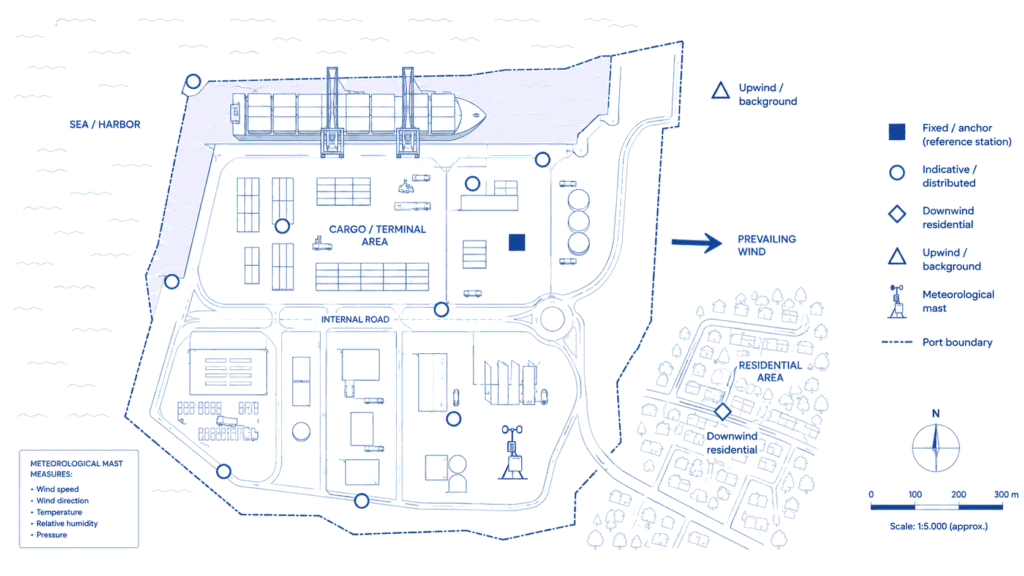
Wind turns this static map into a dynamic one. Predominant wind sectors help identify likely source–receptor relationships, but “upwind” and “downwind” roles change as conditions change. Meteorological data should therefore be part of network design, not an interpretation step added after deployment.
Step 4 — Select pollutants from the monitoring question
There is no universal port sensor package. Select pollutants from the activity, expected emission profile, receptor question and intended measurement status.
| PORT CONTEXT | USEFUL STARTING PARAMETERS | WHAT THE MEASUREMENTS CAN HELP SHOW |
|---|---|---|
| Vessels / berths | NO₂; PM₂.₅; SO₂ where justified; wind | Temporal and spatial changes around berth activity, interpreted with meteorology and other nearby sources. |
| Terminal equipment / road traffic | NO₂; PM₂.₅; PM₁₀; CO where useful | Differences between yards, gates, traffic corridors and comparison locations. |
| Dry-bulk handling / dusty routes | PM₁₀ + PM₂.₅; wind | Coarse-particle events and differences between handling, haul-route and receptor locations. |
| Liquid-bulk / tanker operations | VOC-related measurement where justified; wind | Time-localised changes associated with relevant operations, without treating a broad VOC signal as compound-specific source identification. |
The European Maritime Transport Environmental Report 2025 identifies NOx, SOx and particulate matter among important pollutants associated with ship exhaust. That is useful source context, but it does not make the same pollutant package appropriate for every berth, terminal or receptor.
Ultrafine particles (UFPs) are a specialised case. The recast Directive requires UFP sampling at locations where high concentrations are likely, including locations influenced by air, water or road transport, and defines UFP in terms of particle number concentration rather than the PM₁₀/PM₂.₅ mass metric. In a port programme, UFP should therefore be treated as a dedicated measurement objective using an appropriate particle-number method, not as another channel on a conventional PM mass monitor.
Step 5 — Assign monitoring-point roles and locations
Separate formal assessment locations from operational locations. Where the objective is formal assessment of a port contribution, Annex IV requires at least one sampling point downwind of the main source in the relevant predominant wind direction in the nearest residential area, with an upwind point where background concentration is unknown. Hotspot locations are selected around population-relevant high concentrations, not simply the closest accessible position to a source.
Operational or supplementary nodes can sit closer to berths, cargo areas, roads or gates when the objective is event detection or process comparison. Their role is different: they add temporal and local detail around operations. A source-proximate node should not be described as a population-exposure or formal-assessment site unless it has been selected and qualified for that purpose.
A practical network may therefore combine a fixed authority anchor, receptor-oriented points, distributed operational or indicative points and meteorological measurement. The exact number is project-specific; the design requirement is that each point has a declared comparison role.
Step 6 — Define QA/QC and performance requirements before deployment
Data quality is part of the measurement design, not a reporting task performed afterwards. Calibration and data-quality controls must connect method performance, validation and QA/QC to the relevant objectives; the European Commission technical support document provides the detailed reference-method and non-reference-method context.
For formal indicative use, Annex V sets pollutant-specific uncertainty and data-coverage requirements. For SO₂, NO₂/NOx, CO, PM₁₀ and PM₂.₅, it sets 13% minimum annual data coverage for indicative annual means and 50% for applicable short-term means, with sampling distributed so that the selected periods do not bias the result. Coverage alone is not proof of performance: the method, validation, maintenance, traceability, siting and data handling still have to support the intended assessment use.
For supplementary operational monitoring, QA/QC can be proportionate to the decision risk, but it still needs to be explicit. Define installation checks, maintenance, calibration or adjustment procedures, field verification, data flags, missing-data handling and the conditions under which a measurement is usable.
Step 7 — Connect measurements to modelling, operations and reporting
Document what each point represents and which comparisons are valid. Preserve station metadata, maintenance history, meteorological data and operational records so concentration changes can be investigated rather than merely displayed. Modelling can then interpret wider distribution and representativeness, while operational records help explain when and why patterns change.
From measurements to decisions
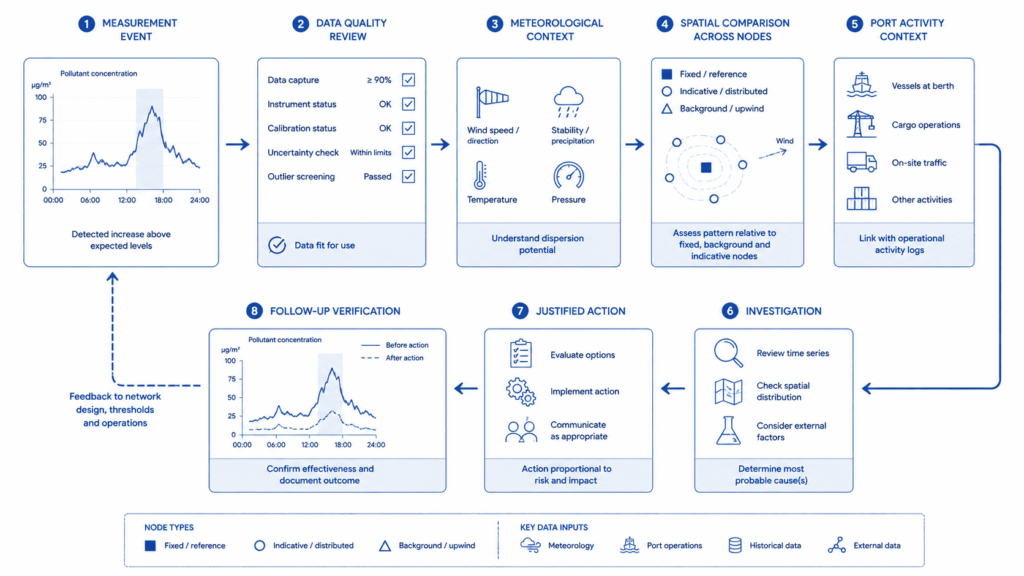
Distributed monitoring becomes decision-support infrastructure only when it is embedded in an interpretation workflow. A concentration increase at one point is an observation, not a source-attribution conclusion; it must be checked against data quality, meteorology, other locations and operational context.
Measurement → QA check → meteorological context → spatial comparison → operational context → investigation → justified action → verification / reporting
Consider an NO₂ increase at a port boundary. First verify the measurement, then check wind direction and compare the event with upwind, downwind or background locations. Review vessel calls, terminal equipment and road activity only after the spatial pattern is understood. If the relationship repeats under comparable conditions, the evidence can justify a focused investigation, a network adjustment or an operational response. Correlation in one time series is not proof of causality.
The same logic applies when evaluating interventions. Shore power, equipment electrification, traffic-management changes or dust controls should be compared under similar activity and meteorological conditions, using multiple locations where possible. Reporting should state what the measurements represent, what changed, what remains uncertain and whether the evidence is observational, inferential or formally assessed.
Where Aernode fits
Within this framework, the Aernode Air Quality Monitor can support continuous distributed outdoor measurements where a port needs more temporal and local detail around the existing assessment network.
Different node roles can use different pollutant configurations through Aernode Sensor Kits, while compatible meteorological Accessories can add wind context where upwind/downwind interpretation matters.
Measurements from multiple sites can be supervised and reviewed historically in Aernode Cloud, supporting event review and cross-location comparison. The Port Areas application page provides broader context for the same distributed-monitoring approach across berths, terminals, access roads and port boundaries.
Formal status still belongs to the method and monitoring programme, not the product. Aernode can support continuous supplementary monitoring and, where the complete method and programme meet the applicable requirements, formal indicative use. That assessment depends on the pollutant-specific configuration, validation evidence, siting, data coverage, QA/QC and the competent-authority framework.
Design the measurement architecture, not the instrument count
Ports are spatial monitoring environments. Multiple source areas, changing activity, nearby receptors and changing wind mean that no single point can answer every monitoring question.
Indicative measurements create value when they become part of a coherent system in which fixed stations, distributed measurements, meteorology and modelling each answer a defined part of the environmental question. The new EU framework makes that approach more explicit, but usefulness still depends on objective-led design and defensible data quality.
Technical references
3. European Commission, Assessment of ambient air quality.
5. European Environment Agency (2025), Air quality around ports and airports, Briefing 17/2025.