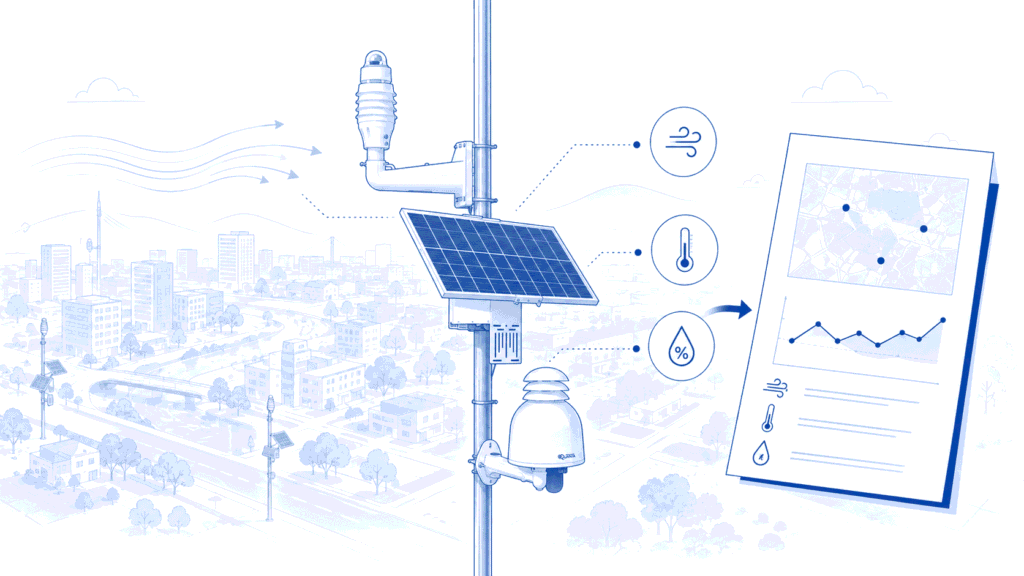
Industrial fenceline monitoring starts with the monitoring question
Industrial fenceline air quality monitoring uses measurement points at or near a facility boundary to observe how particulate matter and gases vary over time and across perimeter sectors. A useful network should not begin with a fixed sensor package or equally spaced instruments; it should begin with the decision the data need to support.
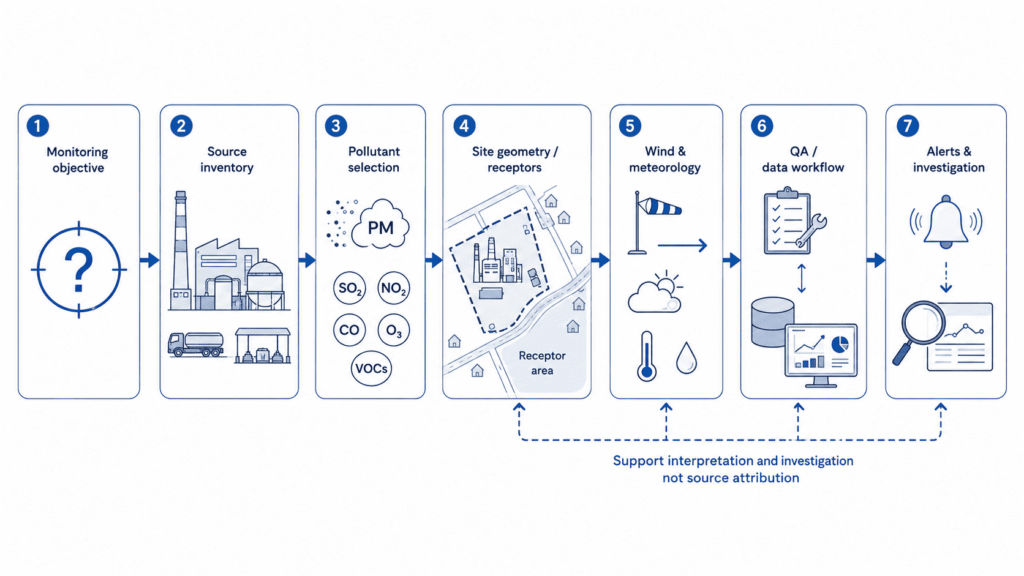
That decision is translated into pollutants selected from the site’s actual sources, monitoring points based on source-pathway-receptor geometry and wind, meteorological context, and a documented quality-assurance and event-response workflow. Node count and placement are therefore site-specific.
Continuous measurements can help environmental teams identify events, compare locations and examine upwind/downwind patterns. They support investigation rather than automatic source attribution, and any prescribed reference or regulatory method still governs the compliance measurement.
Step 1 – Define the monitoring objective before selecting Step 1 – Define the monitoring objective before selecting instruments
“Monitor the fenceline” is not yet a monitoring objective. The design changes depending on what the project needs to learn or decide.
- characterizing background and boundary concentrations over time;
- detecting short-duration particulate or gas events that may be missed by infrequent sampling;
- investigating complaints or odour-related episodes alongside meteorology and operating records;
- comparing conditions before and after an operational or mitigation change;
- identifying areas that merit targeted inspection or more specific sampling; and
- meeting a permit, regulatory programme or agreed monitoring plan.
If a permit or regulatory programme specifies the measurement method, averaging period, siting rule, pollutant or quality requirement, those requirements govern the compliance measurement. A sensor network can still provide a supplementary temporal or spatial layer.
For operational projects, write the question in testable form. “Do concentrations at the north boundary increase during material handling under southerly winds?” can be translated into locations, parameters and data checks; “Is the facility polluting?” cannot be answered by a sensor network alone.
Step 2 – Choose pollutants from the source inventory, not from a generic checklist
There is no universal industrial fenceline pollutant package. Start with the site’s emission sources, materials, fuels, processes and historical concerns, then identify which ambient measurements could provide useful evidence at the boundary.
| SITE SOURCE OR CONCERN | POTENTIAL FENCELINE TARGETS | DESIGN NOTE |
|---|---|---|
| Fugitive dust, bulk materials, internal roads | PM10 and PM2.5 | Coarse material can make PM10 especially relevant. Optical PM data require attention to aerosol properties, humidity and sampling design. |
| Combustion equipment and vehicle activity | NO2/NO, SO2, CO and PM, where relevant | Select gases from the actual fuel and process inventory rather than measuring every combustion-related pollutant by default. |
| Sulfur-containing processes or known reduced-sulfur sources | H2S, where relevant | H2S can support investigation of some events, but it is not a universal measure of odour. |
| Ammonia-related processes or materials | NH3, where relevant | Confirm that the expected ambient concentration range and environmental conditions suit the selected sensor and method. |
| Solvents, fuels and hydrocarbon handling | Broad VOC indicator or a compound-specific method | A broad PID/TVOC response is not equivalent to measuring a specific compound such as benzene. Use a validated compound-specific method when the decision depends on that compound. |
This source-to-pollutant step avoids irrelevant parameters and prevents a broad indicator from being treated as a compound-specific measurement.
Sensor selection must also match the expected ambient concentration range. A device intended for high process or safety concentrations may not provide useful resolution at low environmental levels. For gas sensors, consider cross-sensitivities, temperature, humidity, drift and calibration strategy before finalizing the layout.
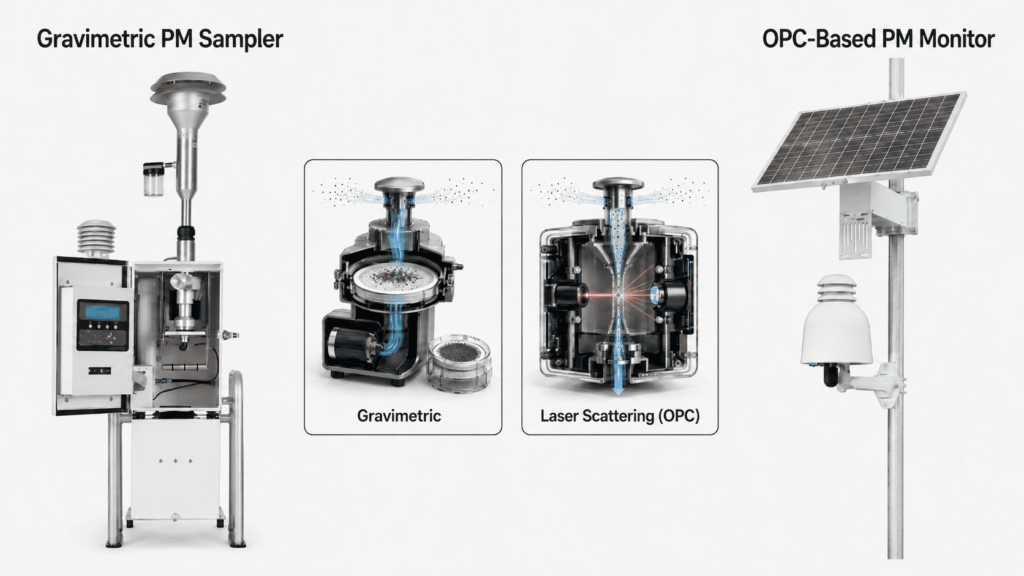
For particulate matter, the measurement principle matters. Optical instruments are valuable for continuous event detection and distributed networks, but their PM mass is estimated from optical particle measurements and can differ from gravimetric reference results. For projects where that distinction matters, the separate guide on OPC versus gravimetric PM measurement provides the measurement context.
Step 3 – Map the site before deciding how many monitoring points you need
A fixed rule such as “one monitor at each corner” is rarely a defensible starting point. Before selecting node count, create a site map that brings together:
- likely emission source areas and release types;
- the property boundary and any inaccessible sections;
- nearby homes, workplaces or other receptors of concern;
- external roads, facilities or activities that may influence background concentrations;
- buildings, walls, vegetation and terrain that can alter local airflow;
- prevailing and seasonal wind patterns;
- available power, communications and safe maintenance access; and
- any existing reference, meteorological or process-monitoring locations.
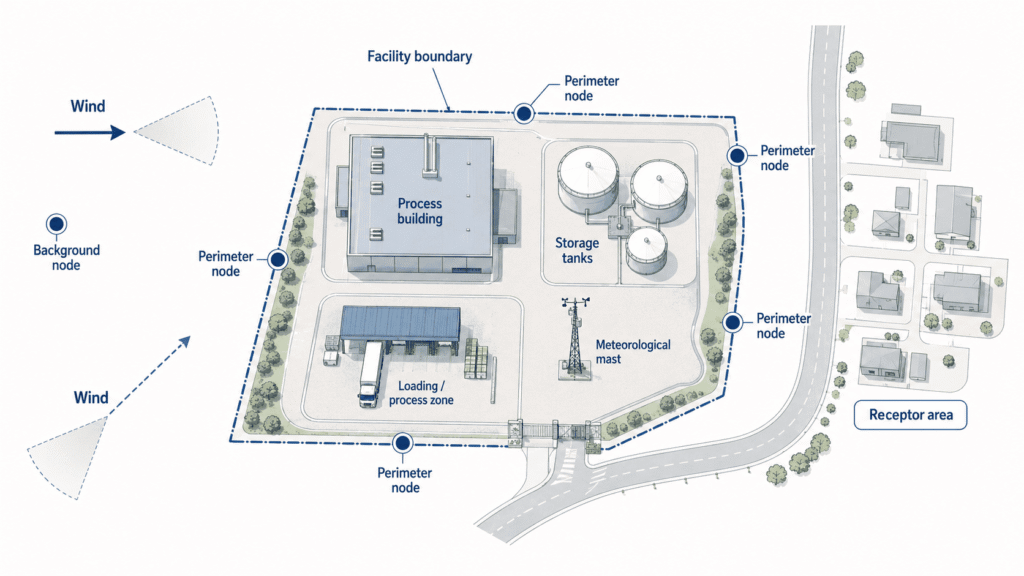
The map turns the perimeter into a source-pathway-receptor problem rather than a geometric one. Some boundaries may need more observation because several source areas can affect them under common wind conditions. Other sections may add little information.
More stations do not automatically make a better network. Additional nodes are valuable when they reduce an important uncertainty, such as separating boundary sectors, observing a receptor-facing edge or providing background context. A poorly exposed, inaccessible or redundant node may add data without adding useful information.
Step 4 – Use wind to create a dynamic upwind/downwind picture
Wind direction is central to fenceline interpretation because the same monitoring point can be upwind of the facility at one time and downwind at another.
Prevailing wind is useful for initial planning, but one dominant direction can miss seasonal or short-term changes. Where feasible, include locations that can characterize background or upwind conditions and locations likely to intercept air moving from relevant source areas toward the boundary. Multiple points become particularly useful when wind direction varies.
Local meteorology strengthens interpretation. Pairing wind speed and direction with concentration data helps determine whether an event occurred when a monitor was plausibly downwind of a source area. Temperature and relative humidity also matter because they affect atmospheric conditions and some sensor responses.
Wind context improves interpretation but does not establish source attribution. Buildings, topography, thermal effects and external sources can complicate transport. Where attribution is an objective, results may need support from dispersion analysis, compound-specific sampling, inspection, process data or other evidence.
Avoid common siting mistakes
Once strategic locations are chosen, the immediate installation environment matters. A monitor intended to represent ambient boundary conditions needs unobstructed airflow and should not sit beside a local exhaust, enclosed corner, dense vegetation or another feature that dominates the measurement unless that feature is intentionally being investigated.
Keep inlet exposure and installation reasonably consistent across comparable nodes. Document installation height, nearby obstructions and site-specific constraints so later interpretation does not treat unlike locations as equivalent.
Step 5 – Build quality assurance into the network design
A fenceline network is not finished when the hardware is installed. The quality plan should be designed at the same time as the sensor layout, defining how instruments are checked before deployment, how performance is tracked in service, and how adjustments and quality flags remain traceable in the dataset.
Before deployment
- Run side-by-side checks across network instruments and, when warranted and feasible, collocate them with an appropriate higher-quality or reference instrument.
- Document calibration, correction or adjustment methods before data collection begins.
During operation
- Maintain time synchronization across concentration, meteorological and operational datasets.
- Check for drift, fouling, blocked inlets, power and communications faults.
- Track data completeness and maintenance records, and periodically confirm that the network still represents the site as processes or layouts change.
Data interpretation and traceability
Preserve raw measurements, adjusted values and quality-control flags as distinct data states. Collocation matters especially when comparing nodes: if two units respond differently under the same exposure, an apparent spatial difference can be mistaken for a site pattern.
Interpret quality checks in light of sensor-specific influences. Gas measurements can be affected by interferents and environmental conditions; optical PM measurements can be affected by humidity, aerosol properties and coarse-particle sampling.
Step 6 – Design alerts around decisions, not isolated spikes
High-frequency data are useful only when the project defines what happens after an unusual value is detected.
A single instantaneous reading should not automatically be treated as an emission incident. A more robust rule may combine persistence, agreement between nearby parameters or nodes, wind sector, instrument status and a project-specific concentration threshold. Document the event logic before deployment so it can be applied consistently across shifts and reporting periods.
An event workflow can follow a sequence such as:
- verify the instrument status and quality-control flags;
- compare the event with nearby monitoring points;
- check wind speed, wind direction and other meteorological conditions;
- review relevant site operations and known external activities;
- decide whether inspection, targeted sampling or another action is justified; and
- record the evidence, action and remaining uncertainty.
Alert thresholds should match the intended measurement use. Do not copy a regulatory limit into a sensor alert unless the measurement method, averaging period, uncertainty and purpose are compatible.
Step 7 – Define the data and reporting workflow before deployment
A multi-node network creates value only if its data retain enough context for later interpretation. At minimum, preserve:
- timestamp and time zone;
- monitor identity and location;
- pollutant value and unit;
- raw or adjusted data status;
- quality-control flags;
- wind speed and direction where available;
- other relevant meteorological parameters;
- calibration and maintenance history; and
- data completeness.
Dashboards can show current conditions, while alerts and scheduled reports support operational follow-up. Historical records should allow teams to reconstruct what the network measured, how data were processed and what was happening at the site during an event.
For complaint investigation or stakeholder reporting, preserve meteorological context, quality flags and the measurement method; otherwise a chart can imply more certainty than the evidence supports.
How Aernode fits an industrial fenceline network
Aernode can combine particulate matter, project-relevant gas sensing and meteorological measurements within a distributed monitoring architecture configured around the site’s monitoring objective. This supports a project design in which sensing and node placement are defined from the source inventory, boundary sectors and meteorological context rather than from a fixed parameter package.
Centralized data management and reporting tools can bring measurements, meteorological context, alerts, historical analysis and reporting into one workflow for operational oversight and event investigation. This allows the same project logic used to design the network to carry through into review and reporting.
Where a prescribed reference or regulatory method applies, Aernode should be used as a supplementary monitoring layer—or as indicative measurement only where the applicable data-quality and measurement requirements are met—rather than as a substitute.
Industrial fenceline network design checklist
Before deployment, confirm that the project can answer each of these questions:
- What decision or uncertainty is the network intended to address?
- Which site sources and processes make each selected pollutant relevant?
- Which locations represent background, likely downwind sectors or receptors of concern under relevant winds?
- How will wind speed and direction be measured and used in interpretation?
- How will instruments be collocated, calibrated, checked and maintained?
- What information will trigger an alert or event investigation?
- How will raw/adjusted status, quality flags, meteorology and maintenance history be preserved?
- What evidence would be needed before making a source-attribution or compliance conclusion?
Answering these questions before installation helps ensure the network produces decision-ready evidence rather than simply more measurements.
Technical references
- U.S. Environmental Protection Agency. The Enhanced Air Sensor Guidebook (2022) — https://www.epa.gov/air-sensor-toolbox/how-use-air-sensors-air-sensor-guidebook
- U.S. Environmental Protection Agency. A Guide to Siting and Installing Air Sensors — https://www.epa.gov/air-sensor-toolbox/guide-siting-and-installing-air-sensors
- UK Environment Agency. Monitoring ambient air: monitoring strategy (2024) — https://www.gov.uk/guidance/monitoring-ambient-air-monitoring-strategy
- European Commission Joint Research Centre. Guidance on low-cost sensors deployment for air quality monitoring experts based on the AirSensEUR experience (2022) — https://publications.jrc.ec.europa.eu/repository/handle/JRC130050
- World Meteorological Organization. GAW Report No. 293: Integrating Low-cost Sensor Systems and Networks to Enhance Air Quality Applications (2024) — https://library.wmo.int/viewer/68924
- European Union. Directive (EU) 2024/2881 on ambient air quality and cleaner air for Europe — https://eur-lex.europa.eu/eli/dir/2024/2881/oj/eng