Why industrial transparency depends on credible monitoring data
Industrial transparency does not come from publishing more measurements. It comes from creating a traceable evidence chain connecting measurement objectives, measurement approaches, data quality, processing history, interpretation boundaries and stakeholder communication.
Industrial operators increasingly need to explain environmental information to environmental teams, plant management, authorities, employees and communities. For industrial sites, raw values are necessary, but they are not self-explanatory. A concentration on a dashboard does not show whether the location was representative, whether the instrument was operating correctly, whether the value was adjusted after calibration, what the background conditions were or what the site was doing at the time.
That is the difference between data availability and trustworthy information. A credible program preserves enough context for another informed reader to understand how a conclusion was reached. If a community raises a concern, the useful response is not simply a chart: it is an explanation of what was measured, where, with which quality controls and what other evidence was considered.
What makes an environmental monitoring program credible?
A credible monitoring program connects the environmental question to the evidence collected. Measurement quality matters, but so do purpose, traceability and context.
Define the monitoring objective
Every program should begin with the question it needs to answer. Objectives may include understanding baseline conditions, identifying trends, investigating concerns, supporting communication or improving internal environmental management.
Those objectives lead to different designs. A short-event investigation may prioritise continuous data and several locations; a long-term trend program may emphasise continuity and calibration stability. The instrument should follow the decision, not become the strategy.
Select appropriate measurement approaches
Different methods answer different questions. Formal ambient-air assessment may use fixed measurements, indicative measurements and modelling under the applicable framework, while supplementary continuous networks can add time-resolved local evidence. Reference methods define specific standardised measurement methods and should not be treated as a synonym for fixed measurements.
The practical question is not “Which instrument is best?” but “Which evidence combination can answer the question?” A local investigation may need continuous measurements plus meteorology and operational records; a formal assessment may require specific assessment roles, methods and data-quality requirements.
Maintain data traceability
Traceability means preserving the relationship between the original observation and the value later analysed or reported. It includes timestamps, location and device identity, calibration status, metadata, quality flags, processing steps and any corrections or adjustments.
Raw and processed information can both be useful. Credibility depends on distinguishing them and recovering the processing history. A clean-looking dataset is not more credible if its transformation cannot be explained.
Add environmental context
Meteorology affects transport and dispersion. Background concentrations can change independently of site operations. Nearby roads, construction or other activities can influence a monitoring point, while operational state can change the pattern around a facility.
Historical comparison can show whether an event is unusual. Wind can show whether transport from a site area was plausible, but does not prove attribution. Operational records can show coincidence with a process change, but coincidence is not causation.
Continuous monitoring, reference monitoring and modelling answer different questions
Environmental assessment combines different evidence roles and different ways of collecting data through time. Under Directive (EU) 2024/2881, fixed measurements, indicative measurements and modelling applications have defined roles in ambient-air assessment; objective estimation is also available in specified circumstances. Continuous monitoring is not a parallel statutory category. It describes temporal continuity – how measurements are collected through time and whether a persistent time series is maintained.
Reference methods should also be kept separate from the category of fixed measurement. The Directive specifies pollutant-specific reference methods and allows demonstrated equivalent methods in defined cases. “Fixed measurement” describes an assessment role and sampling-point framework; “reference method” describes the measurement method used to meet applicable requirements.
| Approach / evidence role | Primary question | Practical strength | Important boundary |
|---|---|---|---|
| Fixed measurements | What is ambient concentration within a formal assessment network? | Formal assessment role with stringent data-quality requirements. | Continuity or location alone does not make a measurement fixed; siting, QA and method requirements still apply. |
| Indicative measurements | What additional spatial or temporal information is needed within a defined assessment role? | Defined assessment role that can complement fixed measurements or support assessment where the framework allows. | Indicative is not a synonym for lower-cost or supplementary sensor deployment. |
| Modelling applications | How are concentrations distributed spatially or across scenarios? | Spatial interpretation and assessment support. | Depends on assumptions and input data; evaluated with measurements as applicable. |
| Supplementary continuous monitoring | When and where do local conditions change? | Time-resolved evidence, local comparison, event detection and operational context. | Continuity does not make supplementary data indicative or regulatory. |
Continuous measurement can exist within different monitoring roles; continuity alone does not determine whether a dataset is fixed, indicative, supplementary or regulatory.
Why continuous monitoring adds value beyond compliance
Continuous monitoring can form part of a broader environmental governance approach because it creates a persistent record that teams can review when something changes.
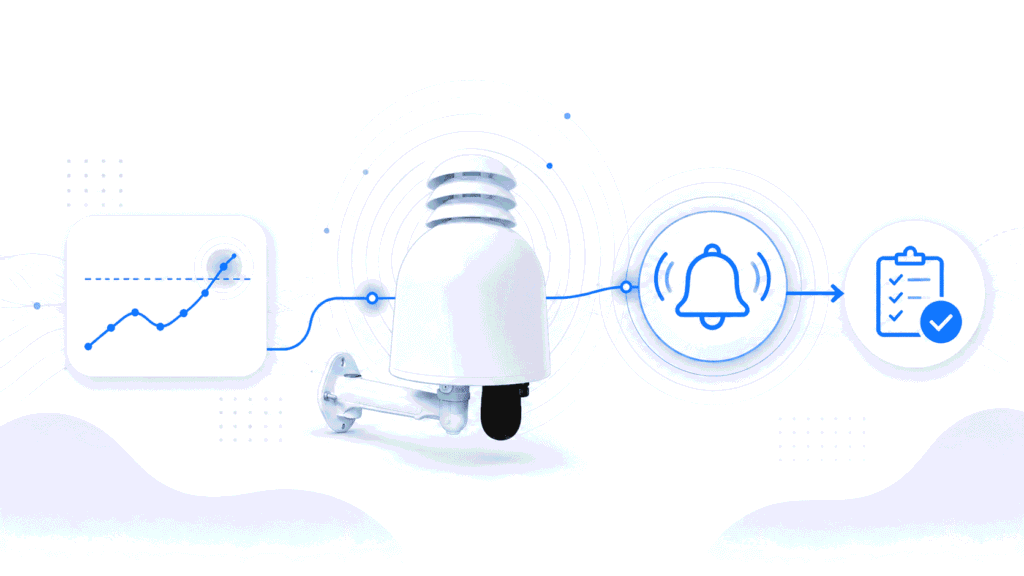
A sustained change in a particulate or gas time series may prompt a quality check, meteorological review, comparison with neighbouring nodes or a check of operations. The measurement does not prescribe the response; it identifies when investigation may be justified.
It can also make stakeholder responses more structured. If a community reports an event, the organisation can compare the reported time with monitoring data, wind, background information and plant activity. The evidence may support further investigation, show no corresponding signal at monitored locations, or remain inconclusive.
For internal management, continuity supports before-and-after comparison when an operating practice, traffic route, maintenance program or control measure changes. This is one way continuous measurement can support an organised environmental-management approach alongside broader Sustainability objectives. Continuous monitoring does not automatically prove compliance and does not replace regulatory methods where those are required.
The real cost of monitoring is maintaining meaningful data quality
The cost of monitoring is not limited to hardware. A useful program includes deployment design, installation, calibration, field verification, QA/QC, maintenance, data validation, interpretation and reporting.
Deployment design determines whether measurements answer the original question; installation affects exposure and representativeness. Calibration and field verification establish system behaviour. QA/QC identifies faults, missing data and drift, while maintenance, validation and interpretation determine what can be used in analysis and reporting.
This is lifecycle measurement quality: sustaining useful, comparable and interpretable evidence over the period in which decisions depend on it. A sensor may still be operating while calibration, contamination, drift, communications or metadata problems have already reduced the value of the dataset. The U.S. EPA Enhanced Air Sensor Guidebook is U.S. non-regulatory guidance, but its fit-for-purpose emphasis is transferable: planning, performance, data management and communication need to be considered together.
A distributed network makes this especially important. More points create more spatial information, but also more devices and data streams. The economic question is the cost of maintaining measurement quality across the network, not simply instrument cost.
This is where the field and data layers need to remain connected. The Aernode Air Quality Monitor can provide a continuous field-measurement layer, while structured data management can preserve calibration status, measurement history and reporting continuity. Software does not remove QA work; it helps keep lifecycle-quality activities connected to the data they affect.
Measurements, interpretation and the risk of misleading conclusions
A measurement value without context can be misunderstood. A concentration does not automatically identify a source. A variation does not automatically indicate operational failure. The absence of a detected signal does not prove absence of impact.
If one perimeter node records a short increase while another does not, the difference may be meaningful, but it still needs meteorological, siting and operational context. A local source, wind shift, obstruction or equipment condition can all change the pattern. Source attribution requires stronger evidence than a single trace.
Responsible interpretation means matching the strength of the conclusion to the strength of the evidence. Monitoring is most useful when it narrows uncertainty, identifies patterns and directs the next question without claiming answers outside its scope.
From measurements to stakeholder reporting: building the evidence chain
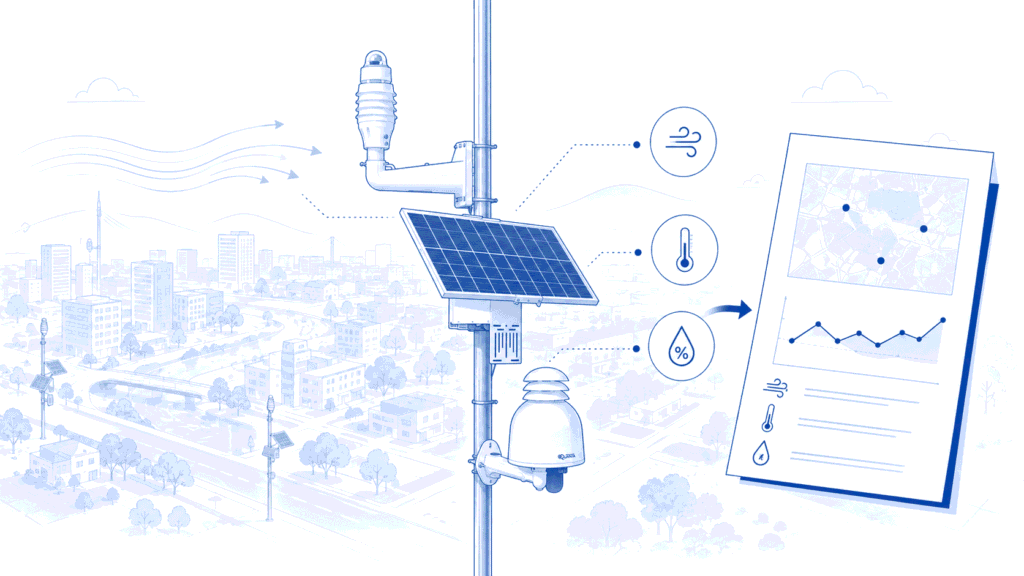
A trusted evidence chain is an information architecture, not a decision in itself. It connects FIELD MEASUREMENT -> DATA COLLECTION -> QUALITY MANAGEMENT -> CONTEXTUALISATION -> INTERPRETATION -> REPORTING -> STAKEHOLDER COMMUNICATION, while keeping the relationship between stages visible.
Field observations remain connected to time-series records and metadata; quality status travels with the data; meteorology and operational context are added before interpretation; and reporting outputs are built from the governed record rather than from isolated values.
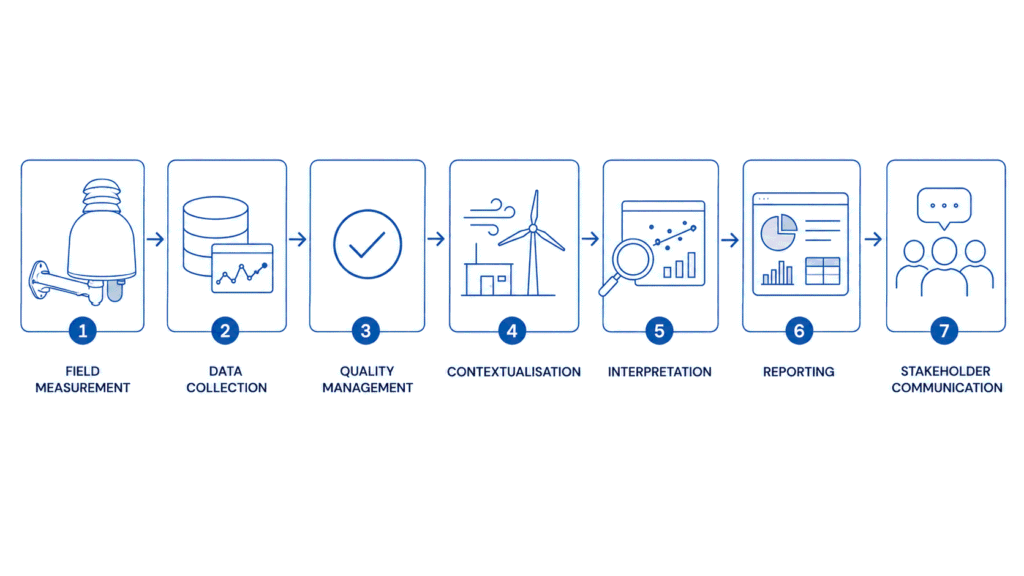
The same underlying evidence can support a technical event review, management summary or stakeholder update without requiring each audience to receive the same level of detail. The architecture protects consistency: different presentations should remain traceable to the same governed record.
How the evidence chain supports environmental decisions
The evidence chain becomes operational when a new observation triggers a controlled review rather than an automatic conclusion.
Observation and QA check
A change in a time series first establishes that something was observed at a defined place and time. The next question is whether the measurement is usable: device status, calibration state, missing-data behaviour and maintenance history may need review before the event is treated as environmental evidence.
Contextual investigation
Meteorology, neighbouring locations, background conditions and operational records are then used to test plausible explanations. A community concern, for example, can be aligned with the reported time window, wind conditions and site activity without assuming that coincidence proves causality.
Interpretation and decision / escalation
The review should distinguish observation, association and inference. The result may justify a targeted inspection, additional measurement, operational review or continued observation; it may also remain inconclusive. The value is a defensible next decision, not forced certainty.
Communication
Communication translates the reviewed evidence for the audience without changing the underlying record. Environmental managers may need an event summary, plant management may need operational implications, and authorities may need method and quality information. Aernode Reporting Tools can support dashboards, historical analysis and reporting outputs built from the same monitoring record; qualified interpretation remains a separate responsibility.
Environmental monitoring and formal reporting frameworks
Environmental monitoring data can support sustainability, environmental management and stakeholder communication, but monitoring data and formal reporting frameworks have different purposes.
Regulation (EU) 2024/1244 establishes a European framework for reporting environmental data from industrial installations and public access through the Industrial Emissions Portal. ESRS E2 addresses pollution-related sustainability disclosures, while GRI 305 provides emissions-related disclosure requirements. These frameworks define reporting contexts, boundaries and methodologies; they do not turn every ambient concentration dataset into a formal emission quantity.
Ambient monitoring usually describes concentrations in air at a location, whereas emissions reporting may concern releases from sources, mass quantities or other defined metrics. Continuous monitoring can therefore support environmental-management and reporting processes without being presented as a substitute for the methods or declarations required by a specific framework.
Data governance: the hidden component of credible monitoring
Credible monitoring requires structured datasets, quality workflows, validation, contextual information and reporting tools that keep the original measurement connected to what is communicated.
Aernode Cloud supports this governance layer by organising time-series records, raw and adjusted datasets, metadata and calibration information within a structured environment. Keeping raw measurements alongside adjusted data preserves the source record while allowing post-processing or calibration models to be applied transparently.
Not every audience needs access to raw data, but the organisation should retain the distinction internally and be able to explain how the reported value was produced. Transparency does not mean publishing every raw measurement to every audience; it means keeping the evidence chain traceable and explainable.
Quality workflows also need history. When a calibration, adjustment model or device status changes, the team should understand how that event relates to data before and after it. Historical comparison is useful only when data treatment remains interpretable.
The practical benefit is continuity from field monitoring to reporting. Measurements can remain connected to quality and context information as they move through data management, historical analysis and communication workflows. That supports an organised process; it does not remove the need for qualified review or make every output suitable for regulatory use.
Public dashboards improve visibility — but visibility is not interpretability
Public or stakeholder-facing dashboards can make selected environmental information easier to access. They can show current and historical conditions, compare monitoring locations and give communities, clients or authorities a consistent view of selected time-series information. That visibility can strengthen transparency when the presentation remains connected to the underlying evidence.
The risk is that a simplified view can remove the context needed to interpret a number responsibly. An instantaneous value can look more significant if the averaging interval is not clear. Colour bands can imply a pass/fail judgement when their basis is unexplained. Missing periods can disappear visually if charts bridge gaps, and preliminary data can appear final if review status is not shown. Maps or side-by-side traces can also encourage source-attribution conclusions that the evidence does not support.
When thresholds or project-defined colour bands are displayed, their basis should be explicit so visual emphasis does not acquire an unintended regulatory meaning.
For stakeholder-facing information, useful minimum context may include:
- pollutant or parameter and unit;
- monitoring location;
- timestamp or reporting period and averaging interval;
- data status, including whether information is preliminary or reviewed;
- quality or data-availability notes where they affect interpretation;
- methodology or explanatory context when needed to understand what the value represents.
Visibility is not the same as interpretability. A public view can simplify presentation, but it should not sever the link to data status, methodology and interpretation boundaries. The objective is not to expose every internal data field; it is to make the information shown understandable enough that a reasonable reader is not encouraged toward a stronger conclusion than the evidence supports.
Building stakeholder trust through transparent environmental information
Stakeholders may include local communities, authorities, employees, environmental specialists and internal management. Their questions differ, but trust depends on the same characteristics: consistency, transparency, documented methodology and responsible interpretation.
For a site operating over many years, a monitoring program can create a historical environmental record showing how conditions were observed, unusual events were reviewed and changes were followed over time. It does not prove that every concern was caused or resolved by the site; it demonstrates that environmental questions are handled through a structured evidence process.
The same principle is relevant to broader environmental-governance work. Monitoring can provide one evidence stream for organisational decisions and stakeholder dialogue, while formal disclosures or assessments remain governed by their own requirements.
Conclusion: credible environmental information requires more than measurements
The value of environmental monitoring is not simply collecting more data. It is creating reliable evidence for better decisions.
A credible program defines its objective, selects fit-for-purpose measurement approaches, maintains lifecycle data quality, adds context and preserves traceability from measurement to communication.
Continuous monitoring provides time-resolved evidence that can complement formal assessment activities. Used responsibly, it can support investigation, internal environmental management and stakeholder communication while remaining complementary to fixed and indicative assessment roles, modelling and other methods required by the applicable framework.
The practical standard is straightforward: every reported environmental conclusion should be traceable back through the evidence chain. When measurement, quality, context, interpretation and communication remain connected, environmental data become information that organisations and stakeholders can use with greater confidence.
Technical References
1. Directive (EU) 2024/2881 on ambient air quality and cleaner air for Europe.