Air quality monitoring for urban areas and traffic
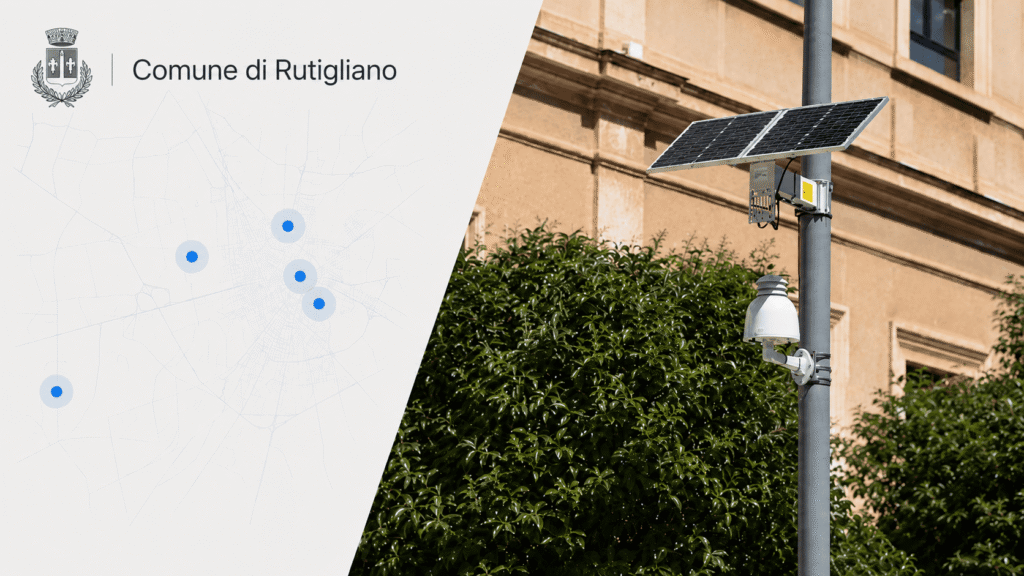
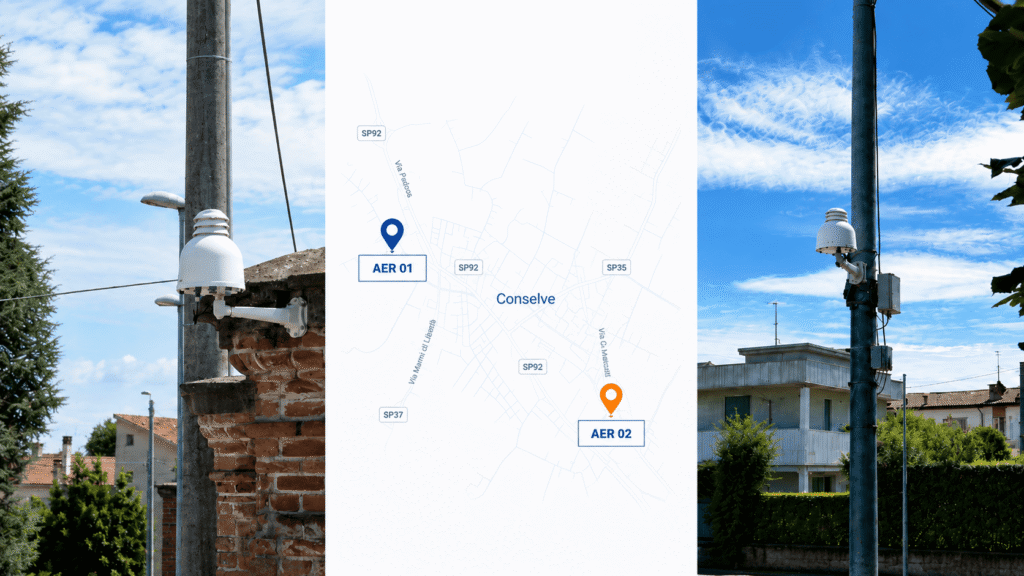
Air quality can vary significantly between streets, neighbourhoods, transport corridors and public spaces. Aernode enables distributed, continuous monitoring across urban environments, providing high-frequency data to understand local patterns, compare locations and follow changes over time. Networks can complement existing reference monitoring with greater spatial coverage, supporting environmental analysis, planning and public communication.
Continuous insight into urban air quality
Air quality across an urban area is not uniform. Traffic intensity, local activities, building density, meteorological conditions and seasonal factors can create significant differences between streets, neighbourhoods and different times of day. Continuous distributed monitoring provides additional spatial and temporal information, helping build a more detailed picture of how urban air quality varies across locations and over time.
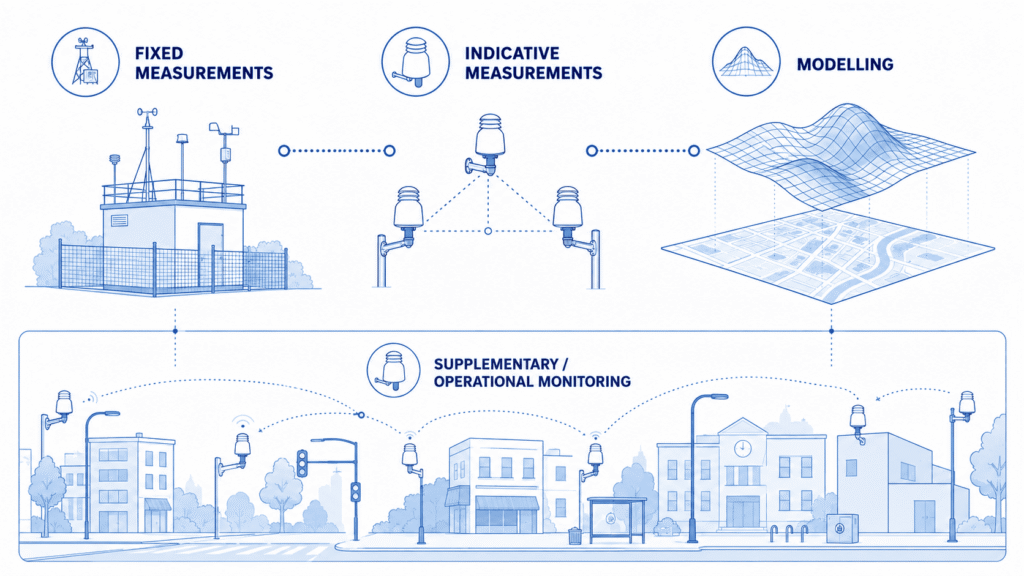
Distributed monitoring can complement reference air quality stations with additional measurement points across traffic corridors, residential areas, public spaces and other locations of interest. Directive (EU) 2024/2881 on ambient air quality recognises the use of indicative measurements alongside fixed measurements and modelling to provide additional information on the spatial distribution of air pollutants. This makes distributed monitoring particularly relevant for indicative air quality programmes, smart city projects, urban environmental studies and the evaluation of local interventions.
The value of distributed urban air quality monitoring
Distributed monitoring can complement established air quality networks with additional spatial and temporal detail, supporting indicative monitoring programmes, local environmental analysis and a better understanding of how air quality varies across urban environments.
Complement reference monitoring
Distributed monitoring can add measurement points across streets, neighbourhoods and traffic corridors, complementing reference monitoring with greater spatial detail and helping characterise local variations between different urban environments.
Compare locations and local conditions
Measurements from multiple locations make it possible to compare air quality across different urban environments and examine how traffic, local activities, meteorology and urban form may coincide with observed spatial differences.
Understand patterns over time
Continuous time-series data helps reveal daily, weekly and seasonal variations and allows local air quality to be reviewed across different traffic conditions, weather patterns and periods of activity.
Support evaluation of interventions
Consistent measurements before, during and after mobility, infrastructure, smart city or urban-planning initiatives can provide additional evidence for assessing how local environmental conditions evolve over time.
Integrate multiple environmental data sources
Continuous monitoring data can be combined with reference measurements, meteorological information and other environmental datasets to support analysis, reporting, planning and communication with stakeholders and the public.
A monitoring network designed around the urban environment
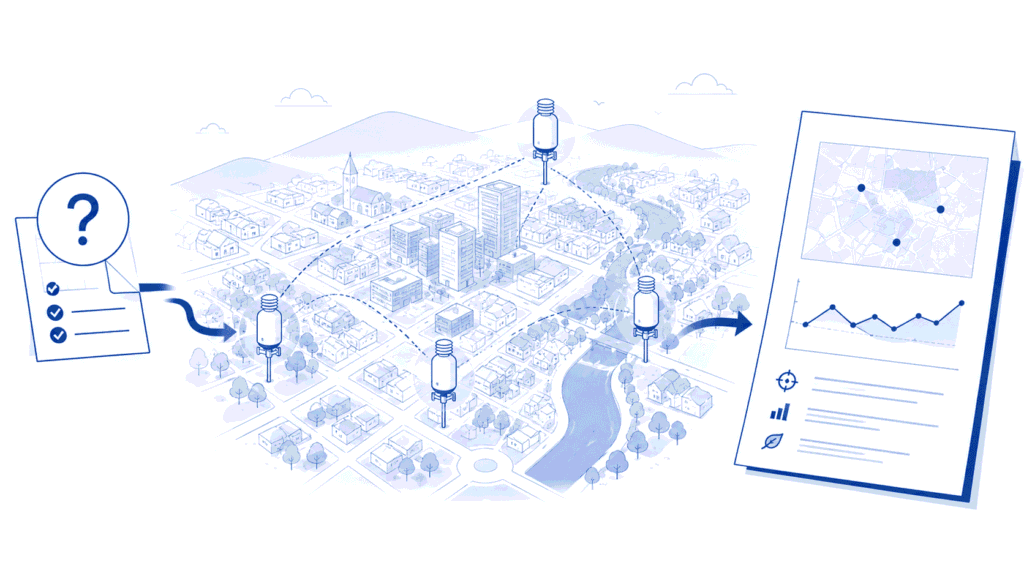
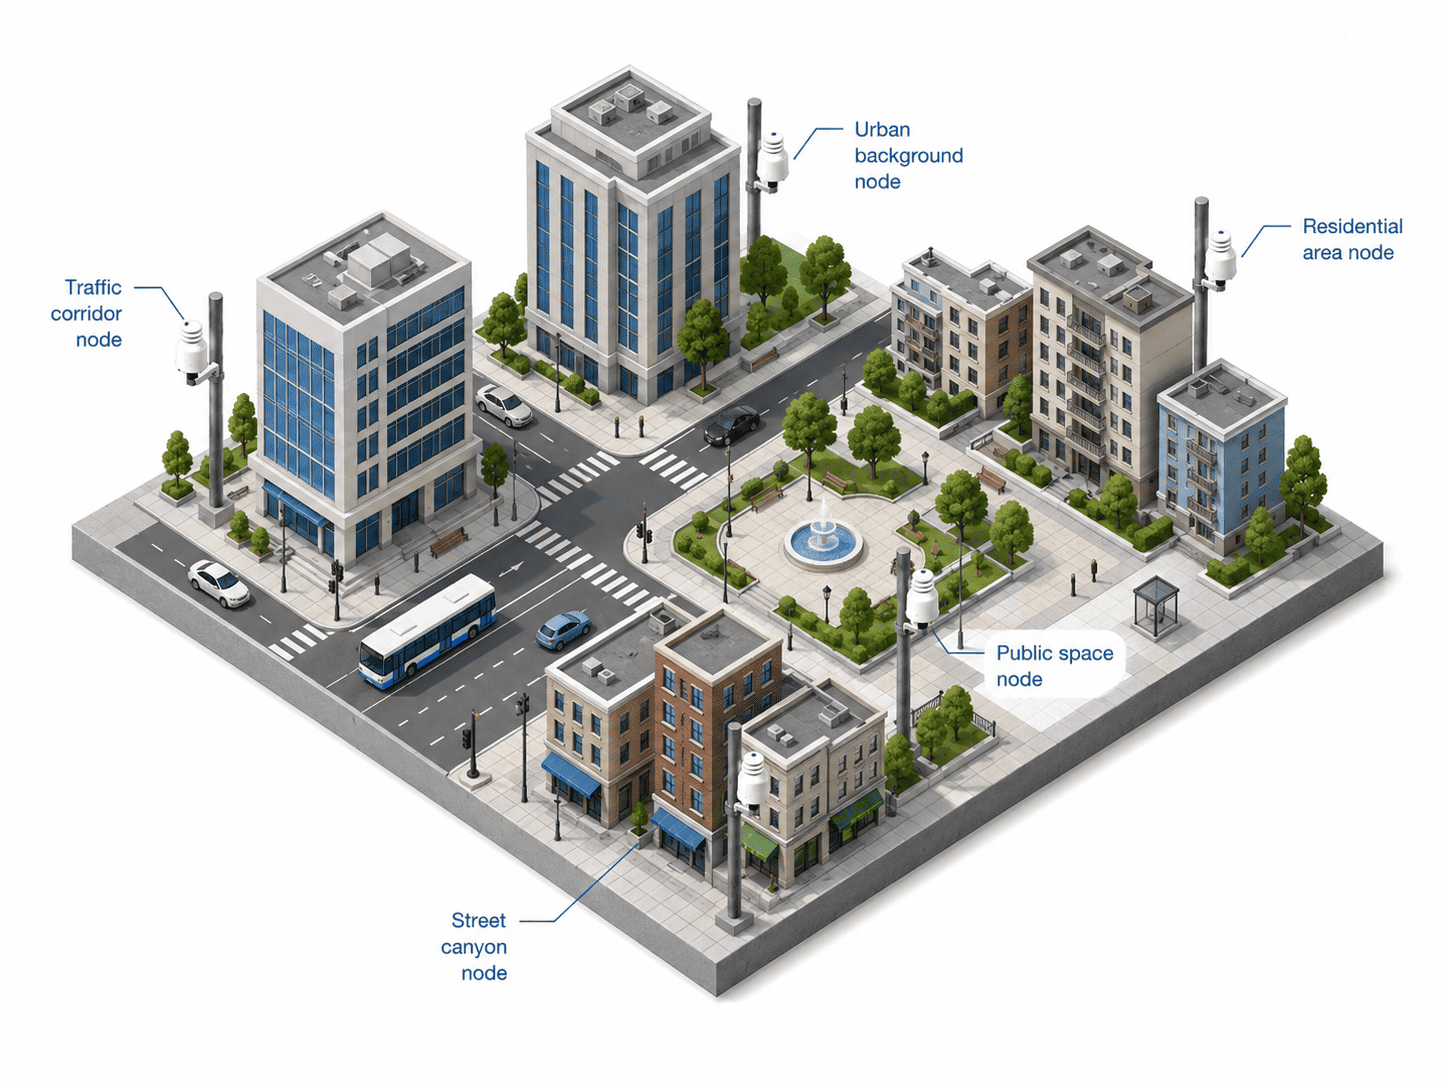
Each deployment is configured around the objectives of the monitoring programme, selecting locations that provide useful spatial coverage across traffic corridors, residential areas, public spaces, sensitive locations and other urban environments of interest.
Define the monitoring objectives
Define what the network should help understand, such as spatial differences across the city, traffic-related conditions, neighbourhood trends, sensitive locations or changes associated with specific urban interventions.
Select representative locations
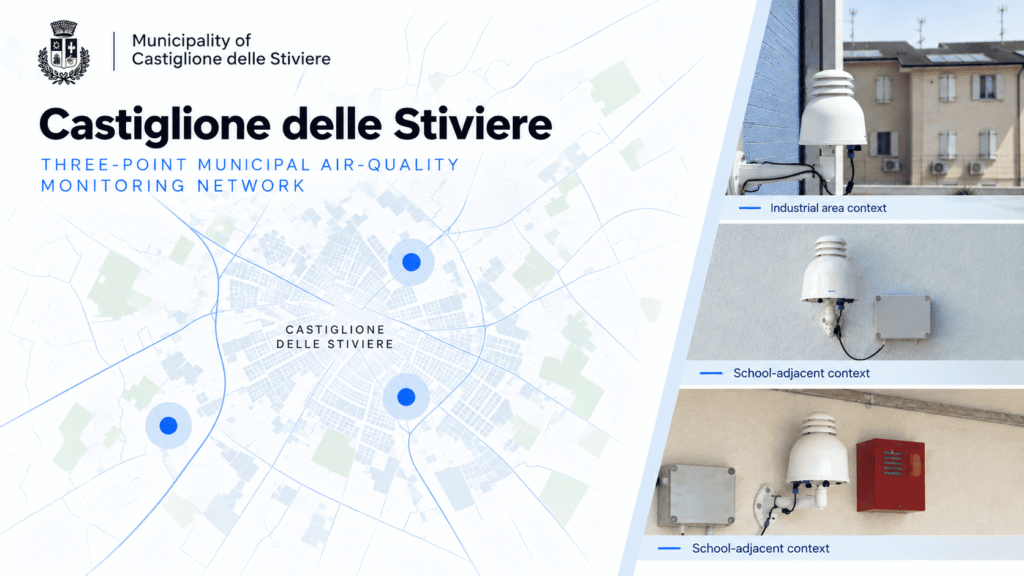
Position monitoring nodes across locations that reflect the environments being studied, including traffic corridors, residential areas, public spaces, sensitive receptors and background locations for meaningful comparison.
Build the data workflow
Combine continuous measurements with meteorological information, dashboards and reporting tools to compare locations, review temporal patterns and turn distributed measurements into a structured urban air quality dataset.
Parameters commonly monitored across urban environments
| Parameter | Why it matters in urban areas and traffic environments |
|---|---|
|
PM₂.₅ / PM₁₀
Particulate matter
|
Particulate matter is a key urban air quality parameter influenced by multiple local and regional sources. Distributed monitoring helps compare concentrations across neighbourhoods, traffic corridors and other urban locations and follow changes over time. |
|
NO₂
Nitrogen dioxide
|
Nitrogen dioxide is particularly relevant in urban environments affected by combustion sources and road traffic. Monitoring at multiple locations can help examine spatial differences and variations associated with traffic intensity, urban form and meteorological conditions. |
|
O₃
Ozone
|
Ozone is a secondary pollutant whose concentrations vary with atmospheric chemistry, meteorology, season and location. Continuous measurements help characterise temporal patterns and differences between different parts of the urban area. |
|
CO
Carbon monoxide
|
Carbon monoxide can provide additional information on combustion-related conditions in selected urban and traffic environments. Continuous monitoring allows concentration variations to be compared across locations and periods of activity. |
|
dB
Environmental noise
|
Environmental noise can complement air quality measurements in traffic corridors and other urban locations, providing an additional indicator for characterising changing environmental conditions around mobility, infrastructure and public spaces. |
|
Meteo
Meteorological parameters
|
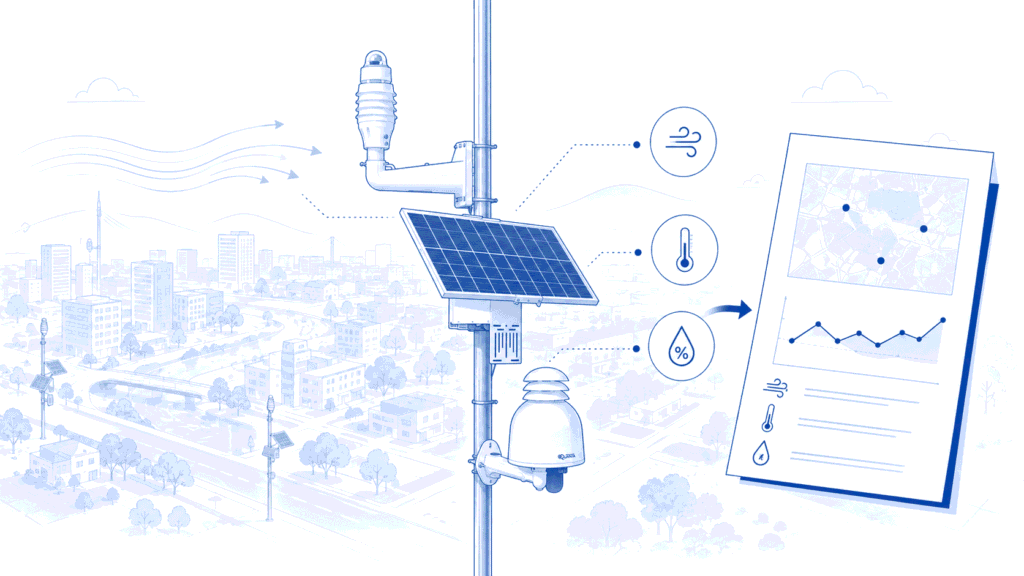
Temperature, humidity, wind and other meteorological variables provide essential context for interpreting air quality measurements and understanding how environmental conditions evolve across locations and over time. |
Monitoring configurations are project-specific; particulate matter, NO₂, O₃, CO, environmental noise and meteorological parameters can be selected according to the urban context, monitoring objectives and locations of interest.
Explore the Aernode Components
Aernode Monitors
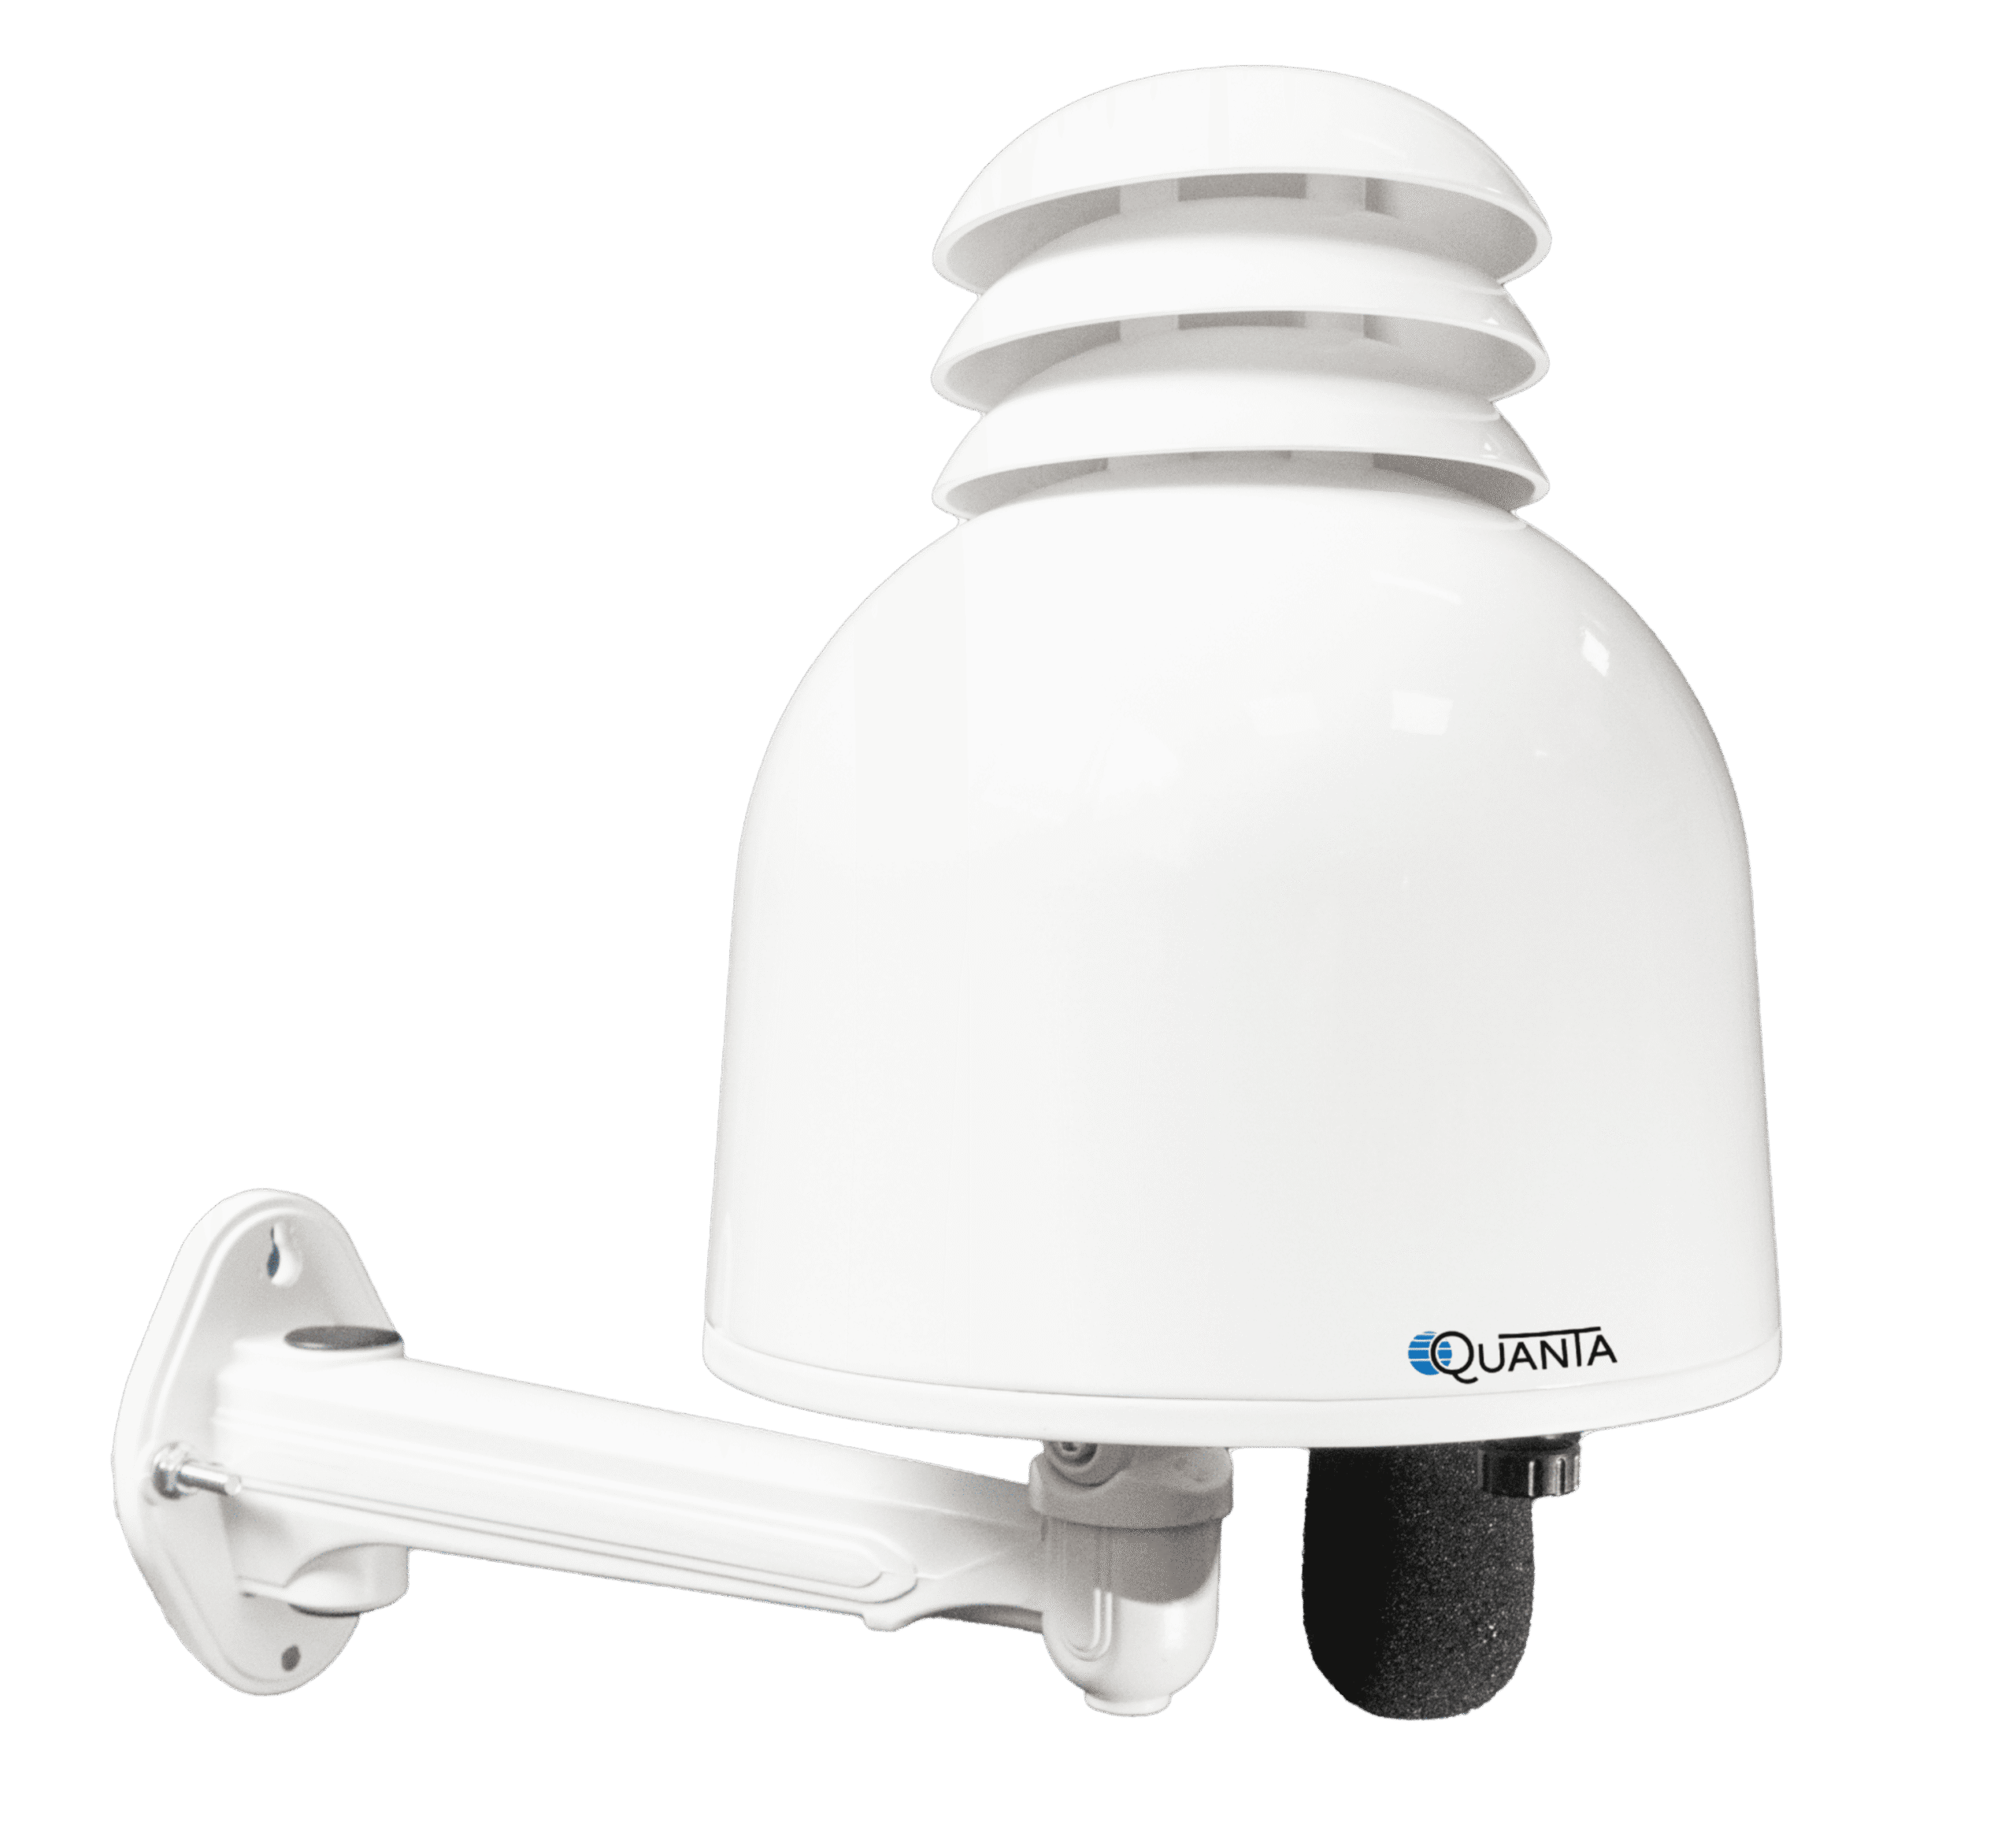
Configurable outdoor stations for continuous measurement of particulate matter, gaseous pollutants and environmental conditions across distributed monitoring networks.
- Site-specific pollutant configurations
- Continuous outdoor data acquisition
- Designed for single-site and multi-node networks

Aernode Cloud
A central environment for device supervision, data storage, post-processing and secure access to current and historical monitoring information.
- Remote network and device management
- Historical records and data continuity
- Authenticated integration through APIs
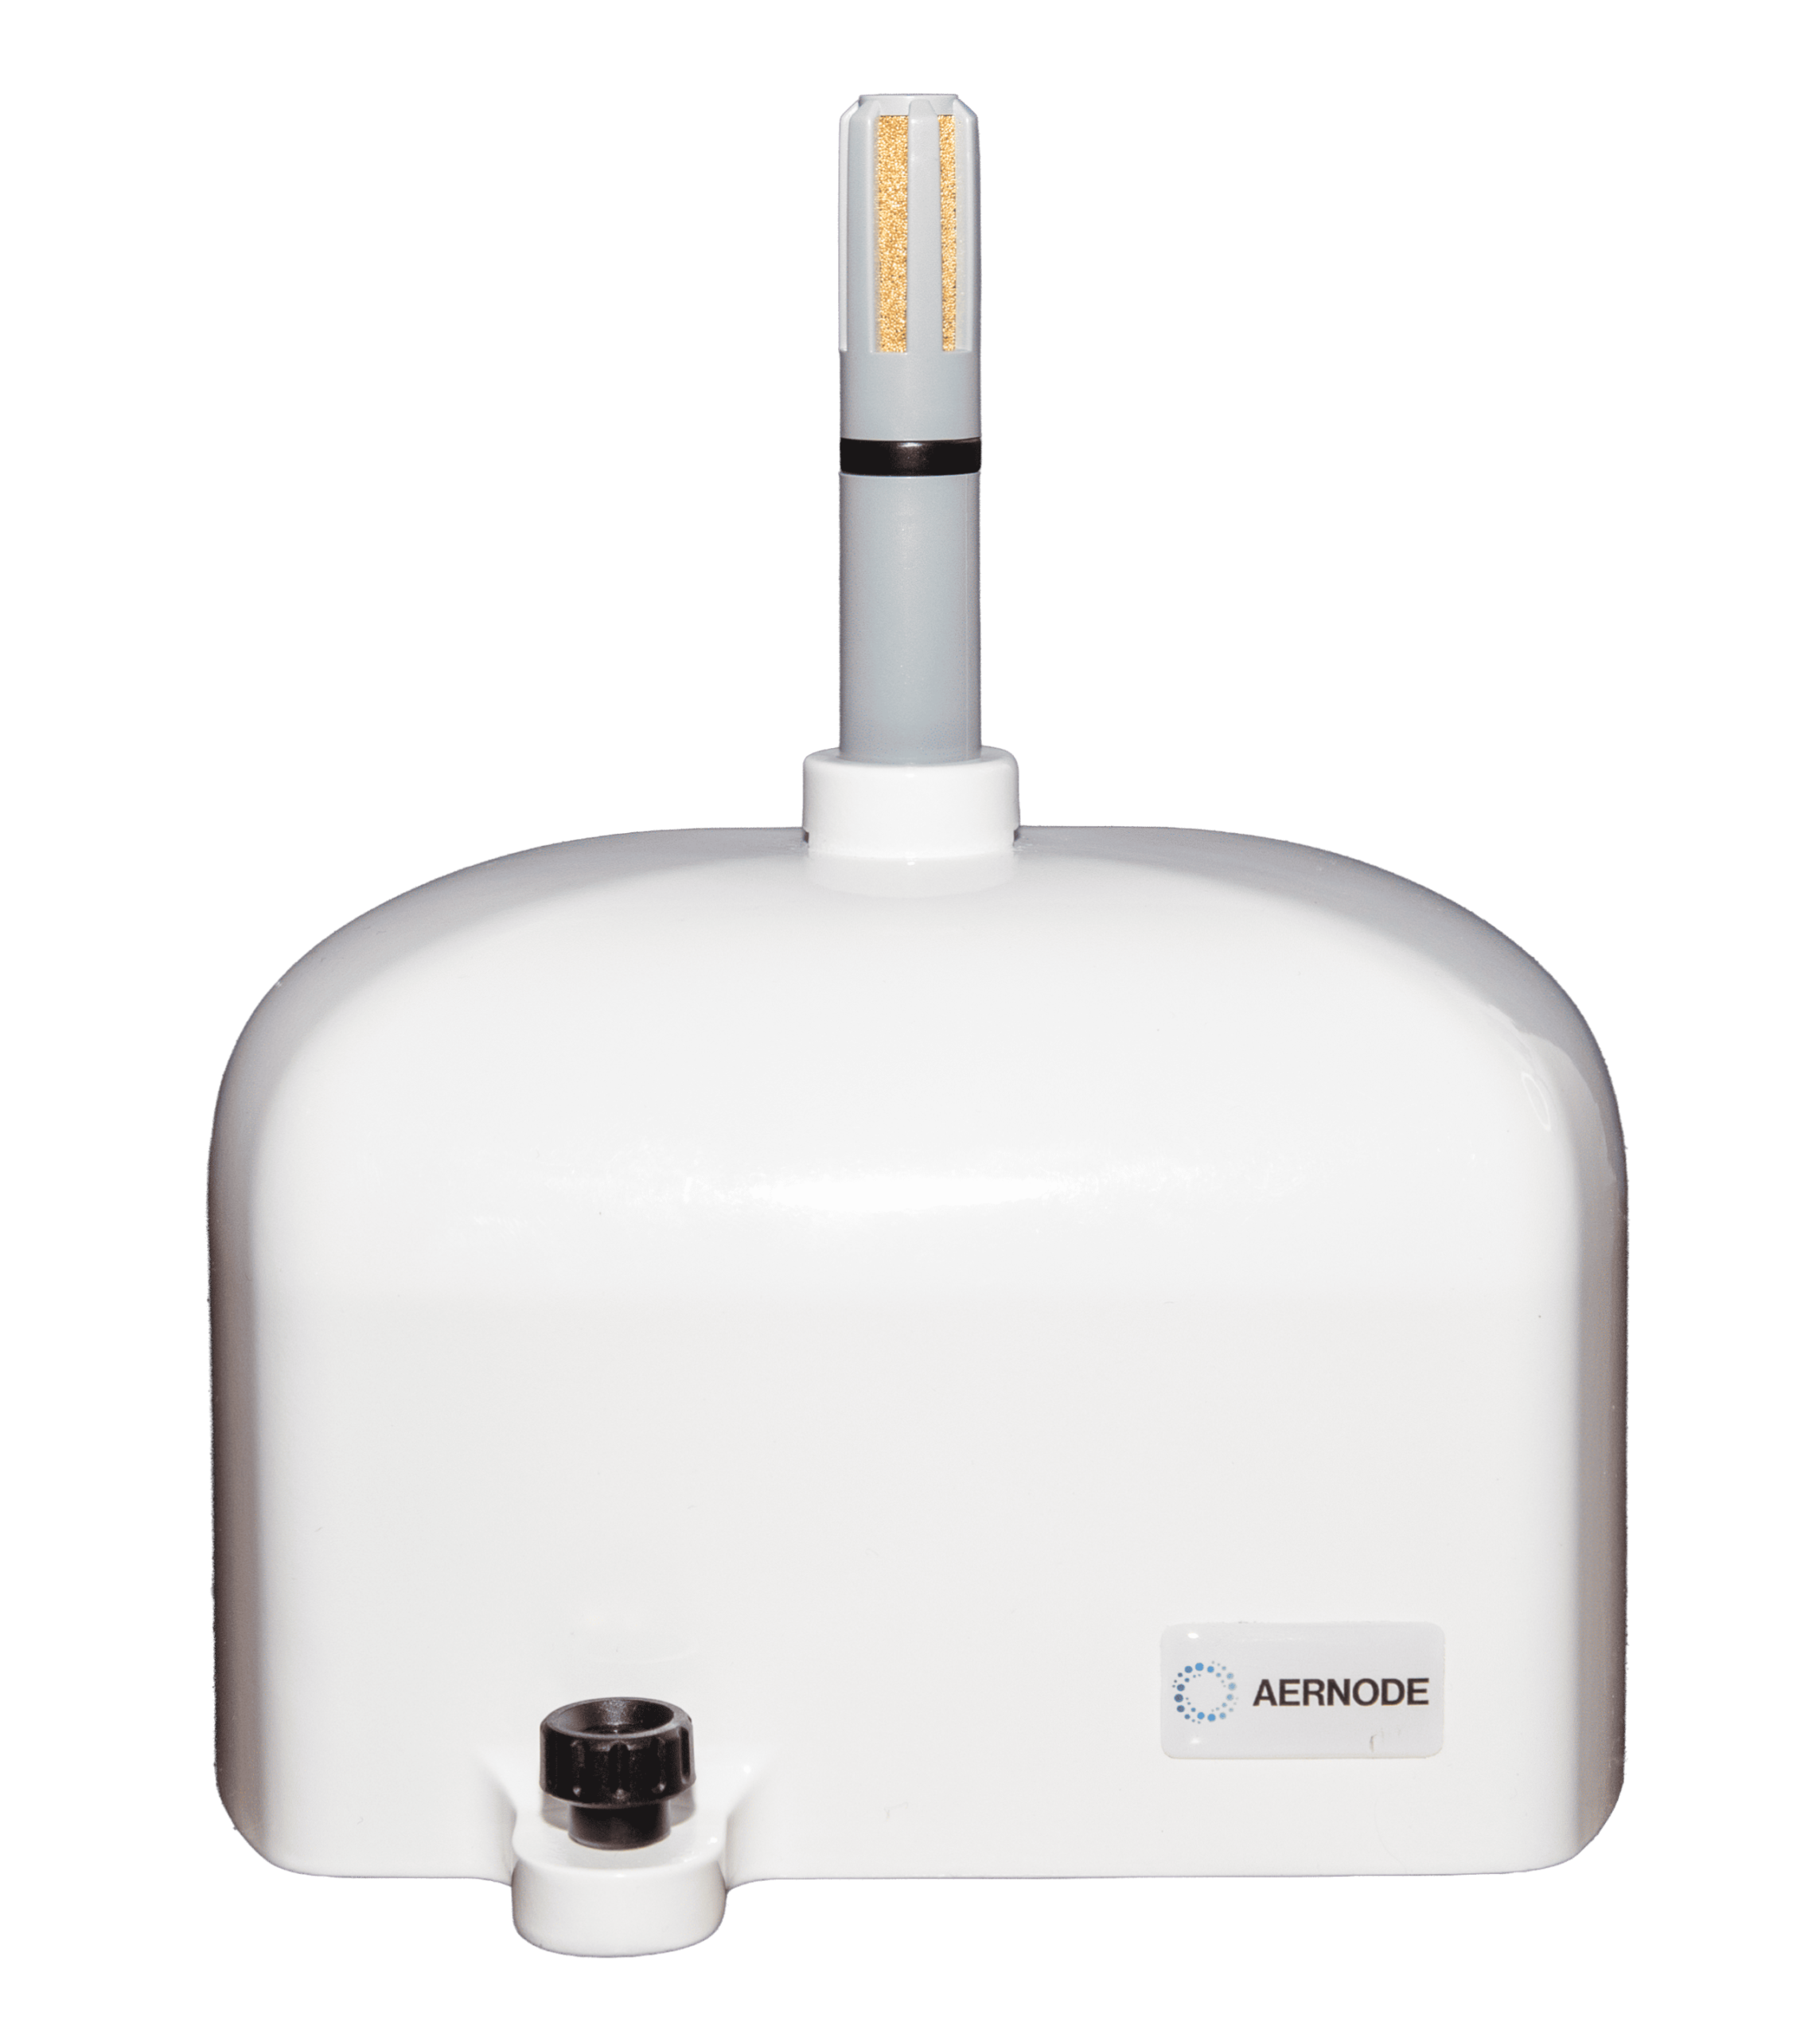
Sensor Kits
Preconfigured sensing assemblies that simplify pollutant selection, field servicing and configuration updates throughout the operating life of the network.
- Modular pollutant combinations
- Efficient field replacement
- Configuration tailored to project requirements
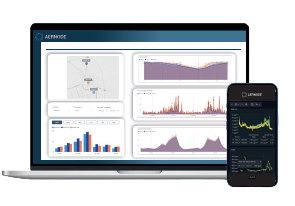
Reporting Tools
Digital environments for current conditions, historical analysis, automated outputs and communication with internal teams or external stakeholders.
- Real-time and historical dashboards
- Threshold alerts and scheduled reports
- Private and stakeholder-facing environments
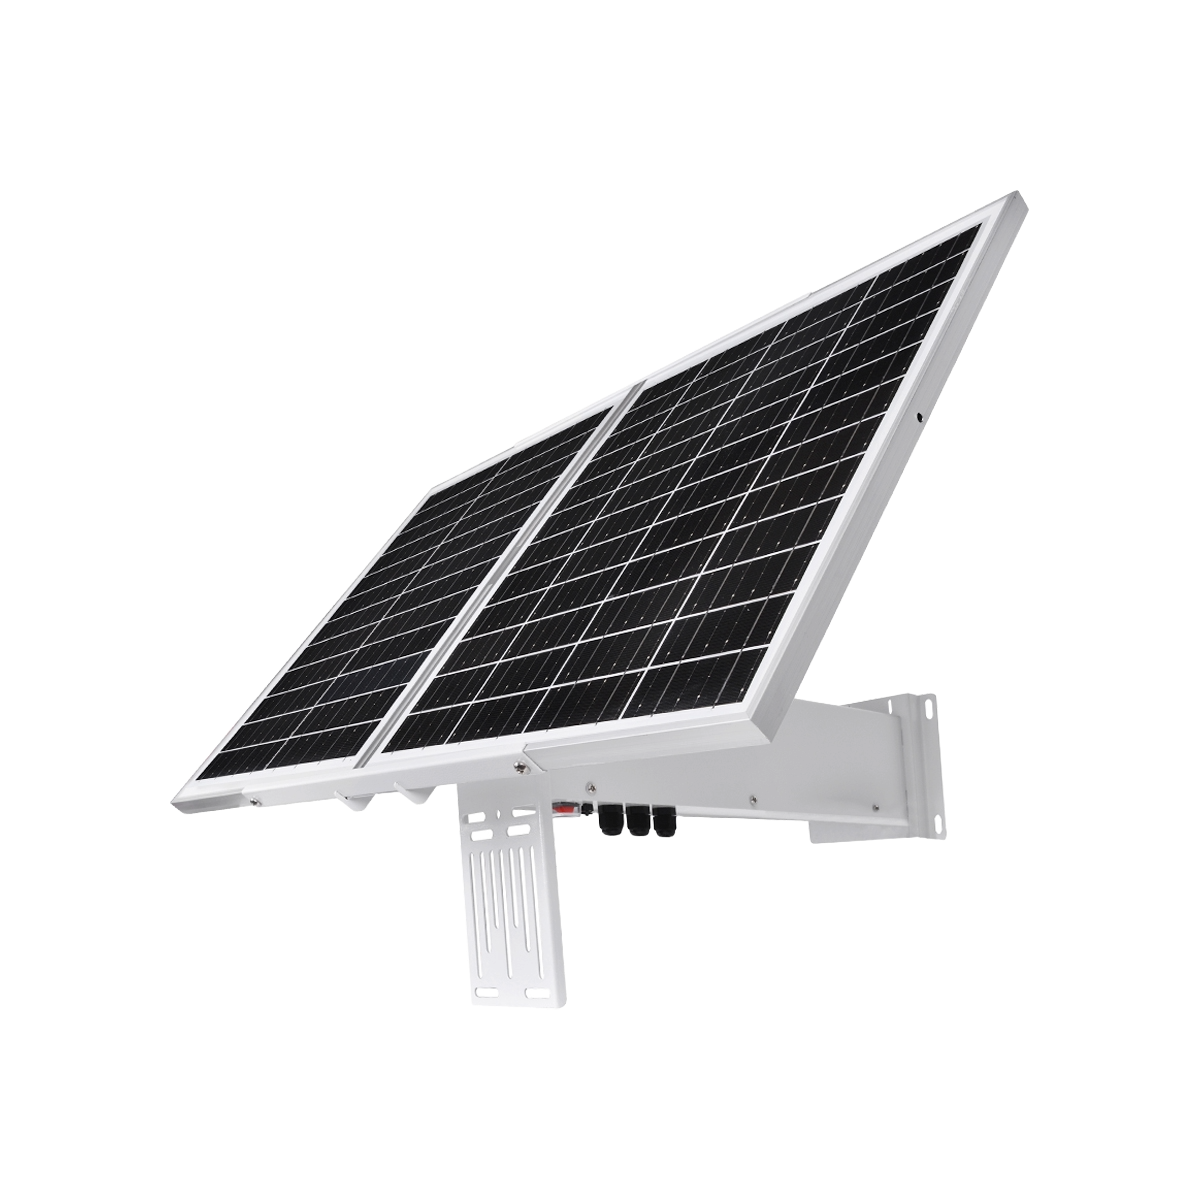
Accessories
Power, meteorological, mounting and connectivity options for fixed-site, perimeter and off-grid monitoring configurations.
- Weather stations and anemometers
- Solar power and autonomous deployment options
- Mounting and connectivity accessories
Frequently asked
questions
Practical answers on distributed urban monitoring, indicative measurements, network design and the use of air quality data in cities.
Why use hyperlocal air quality monitors if a city already has official reference stations?
Official reference stations are essential for regulatory air quality assessment, but their cost, infrastructure and quality-assurance requirements limit how many can realistically be deployed.
A distributed network of Aernode air quality monitors can add continuous, high-frequency indicative measurements at many more locations across streets, neighbourhoods, schools and traffic corridors.
The value of this hyperlocal air quality monitoring is greater spatial detail and local context, complementing reference stations rather than replacing them.
How can municipalities use indicative air quality measurements, and what are their limits?
Aernode indicative measurements can support local environmental knowledge, territorial and mobility planning, hotspot screening, comparison of neighbourhoods, evaluation of interventions and decisions on where further investigation may be useful.
They can also support transparent public communication when their indicative nature is clearly stated.
Aernode data should not be used as the sole basis for formal legal certification or regulatory compliance determination. Those functions rely on competent-authority assessment systems, prescribed measurement methods and defined quality procedures.
Which pollutants should be monitored in urban and traffic projects?
For many urban projects, useful core parameters include PM₂.₅, PM₁₀, NO₂, O₃ and CO.
The European Air Quality Index is based on PM₂.₅, PM₁₀, NO₂, O₃ and SO₂, while CO can provide additional combustion-related context.
If a specific local source is suspected, Aernode Sensor Kits can add targeted compounds such as SO₂, VOCs or other gases. The configuration should follow the monitoring objective rather than use one standard pollutant package everywhere.
How much area does one Aernode air quality monitor cover?
An Aernode monitor measures air at the point where it is installed; it does not have a fixed coverage radius.
The correct concept is spatial representativeness. A well-sited urban-background monitor may be representative of a wider neighbourhood, while a roadside or source-oriented monitor intentionally describes a more local environment.
Representativeness depends on the monitoring objective, nearby sources, buildings, traffic, airflow and siting conditions, so network design should define what each measurement point is intended to represent.
Where should urban air quality monitors be installed?
Siting should follow the question the monitoring network is designed to answer.
Background locations can be used to compare neighbourhood-level conditions, while traffic or source-oriented locations can target busy roads, intersections or other specific influences. Schools, residential areas and public spaces may be added as sensitive locations.
Good installations also require free airflow and suitable distance from unintended local sources or obstructions. A useful city network often combines representative background points with targeted monitoring locations.
Can Aernode data be integrated into municipal platforms and shared with the public?
Yes. Aernode Cloud provides authenticated REST API access so measurement data can be integrated into municipal data platforms, GIS environments, smart-city systems or project-specific applications.
Aernode Reporting Tools can also provide operational dashboards and separate public-facing views.
Municipalities can therefore keep their existing data workflow while deciding which indicative measurements, trends and contextual information should be shared with residents and other stakeholders.
LEARN MORE
Explore technical resources
Plan a monitoring network for your urban environment
Define the right environmental parameters, monitoring locations, connectivity and reporting workflow for continuous monitoring across streets, neighbourhoods, traffic corridors and other urban areas of interest.