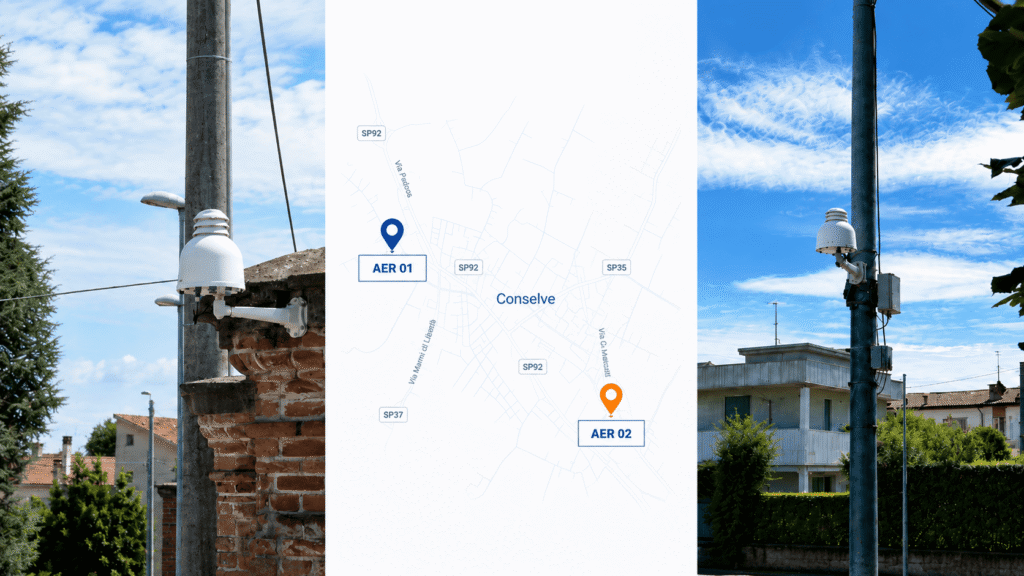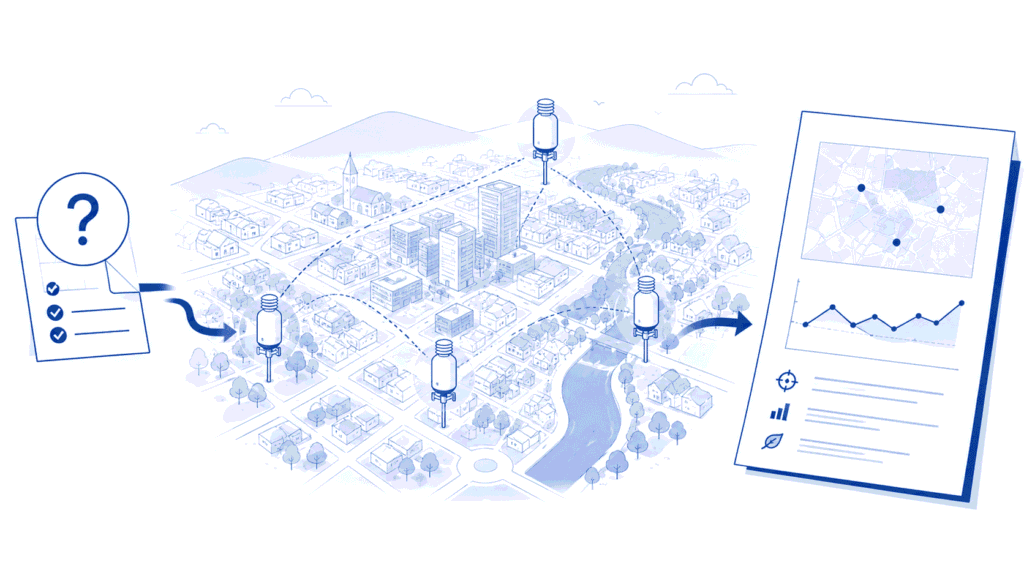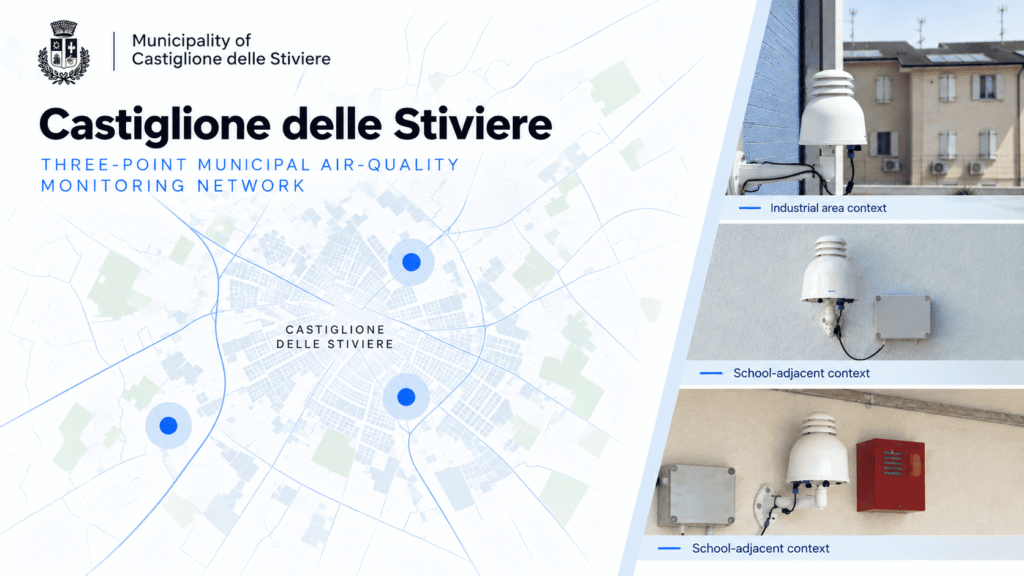
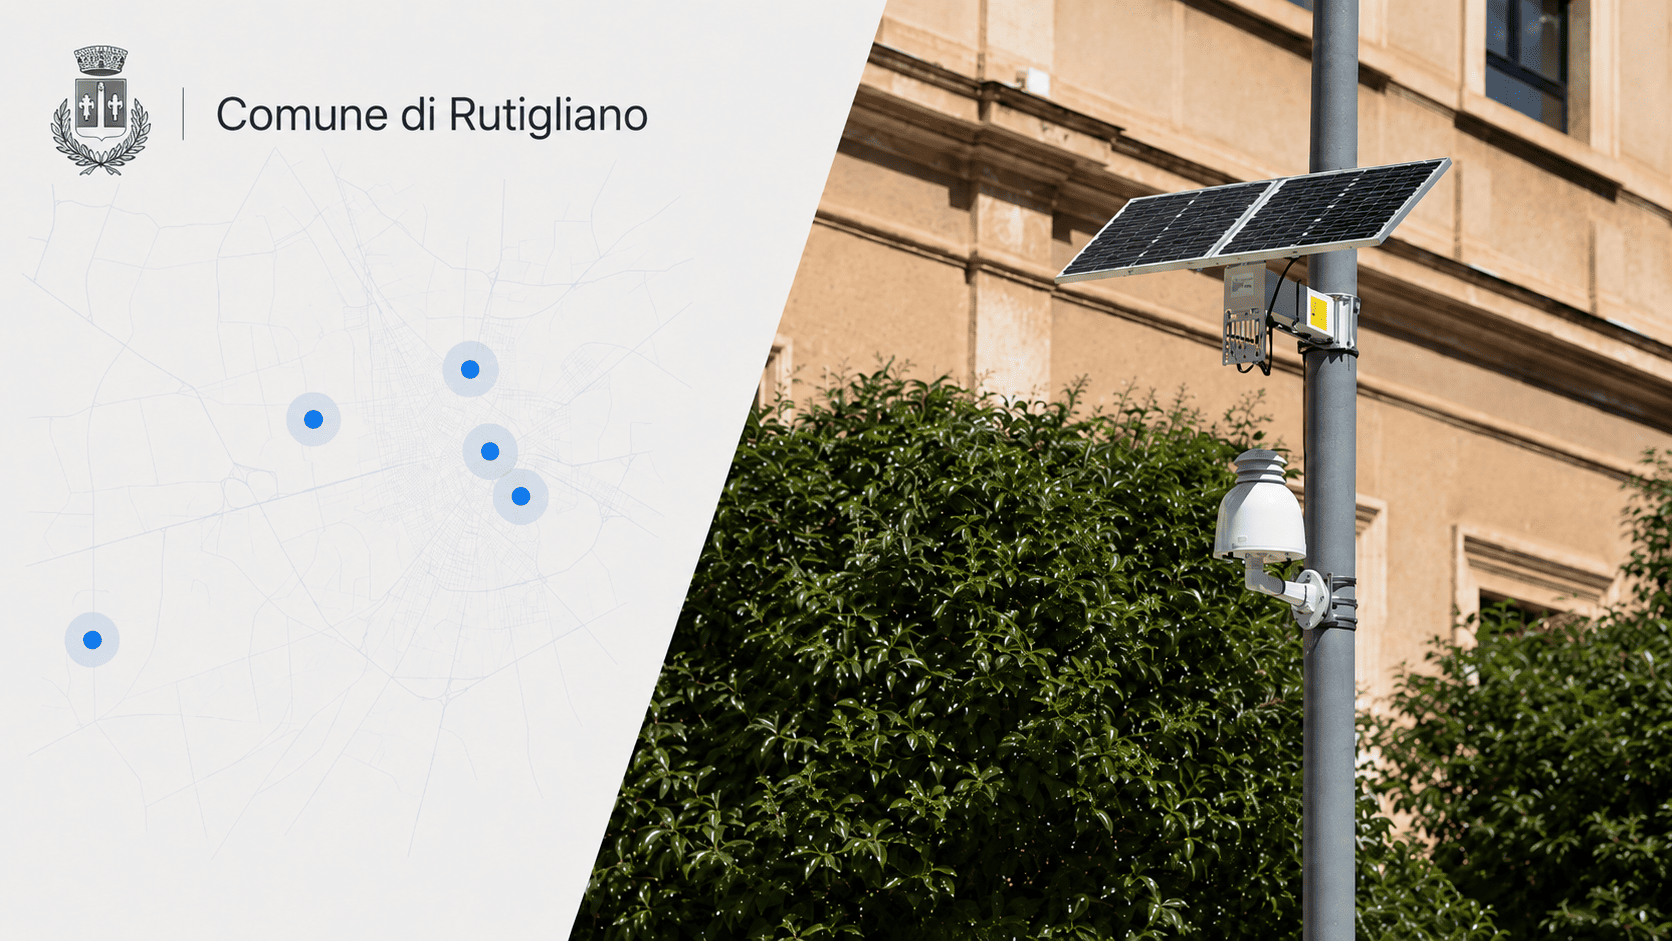
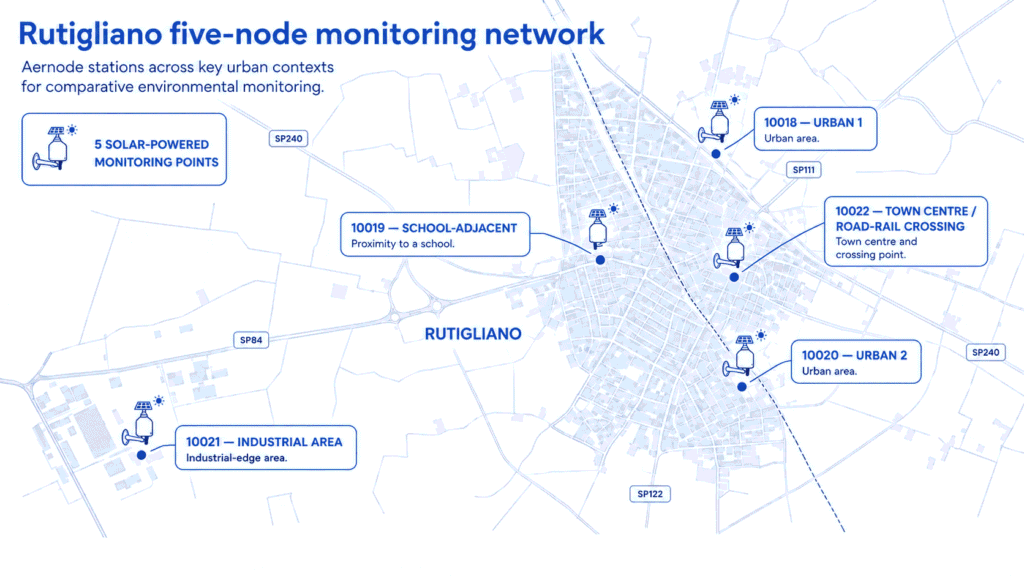
Rutigliano’s municipal monitoring project used five solar-powered Aernode stations to create a distributed local air-quality network without making mains electricity the primary siting constraint. The five points were placed in contrasting contexts – two urban locations, a school-adjacent area, an industrial area and a town-centre traffic / rail context – and configured to measure PM10, PM2.5, NO2 and O3 together with temperature and relative humidity. The project illustrates a practical design sequence: define what each location is meant to observe, solve power and connectivity around those locations, collect a consistent parameter set, and review the resulting data through one common workflow. The network adds local spatial and temporal evidence; it does not by itself identify pollution sources or replace official ambient-air assessment.
Five locations, one municipal monitoring question
The Rutigliano deployment was designed as one five-node network rather than as five independent stations. Each point represents a different local context, so the value comes from comparison: what is happening at one location, what is happening elsewhere at the same time, and whether a pattern repeats across days or remains specific to one site.
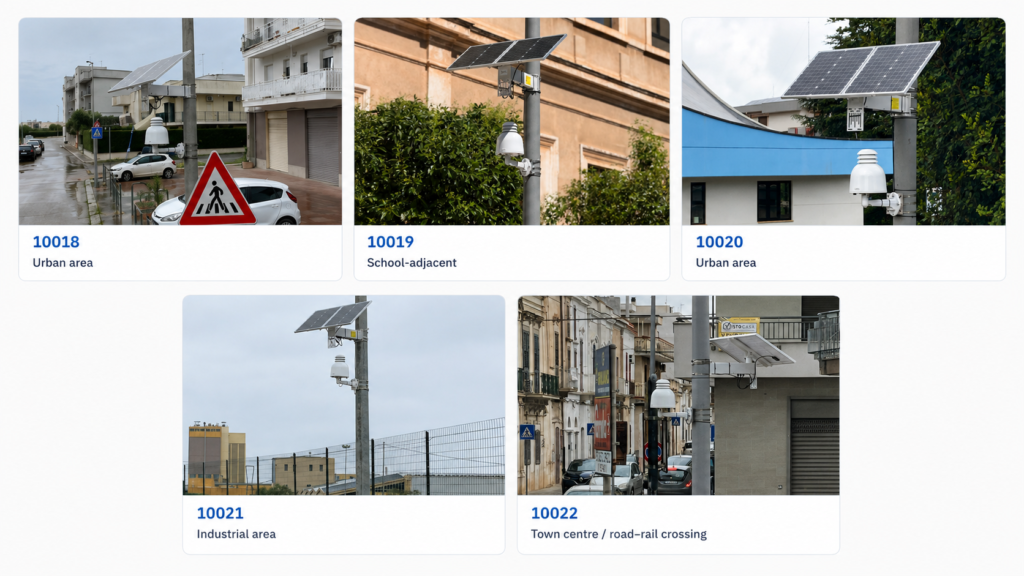
| Monitoring context | Role in the distributed network |
|---|---|
| Urban location 1 | Provides one urban comparison point within the municipality. |
| School-adjacent area | Adds a distinct receptor context near an educational site without assuming that a pollution problem is present. |
| Urban location 2 | Creates a second urban point for comparison across locations and time periods. |
| Industrial area | Adds a productive / industrial context that differs from residential and central urban settings. |
| Town centre near road / rail crossing | Adds a traffic-sensitive comparison point. At the time of deployment, the municipality identified queueing during level-crossing closures as relevant local context. |
That distinction between having more instruments and designing a network matters. European Commission JRC guidance emphasizes study design, verification and quality control for sensor networks. In Rutigliano, the same principle is visible at project level: each node has a reason to be where it is. A difference between two sites can therefore be treated as a reason to investigate context, not as automatic proof of a source or cause.
Solar power enabled siting around monitoring roles
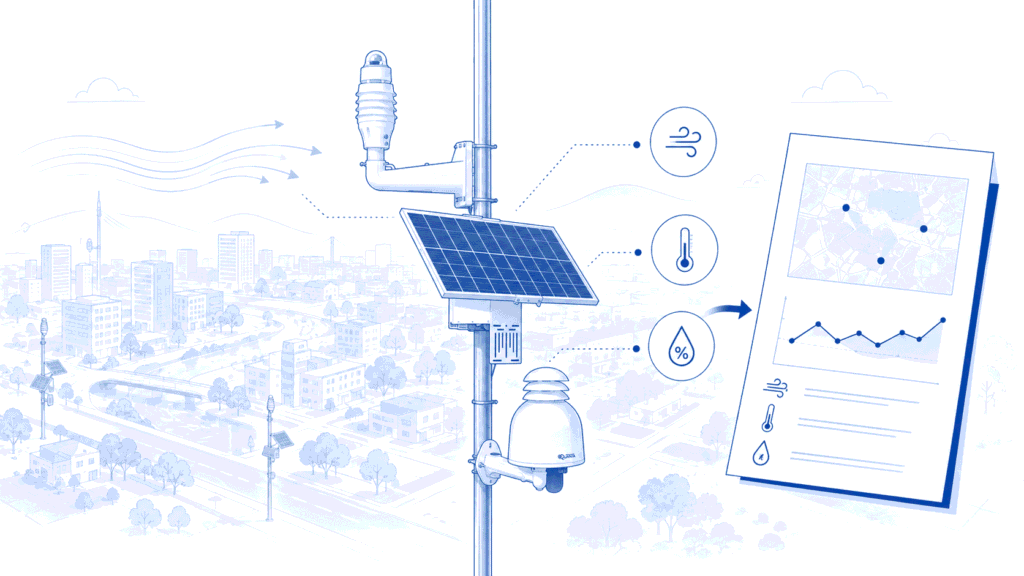
All five Rutigliano stations were deployed with autonomous solar power. The importance of that choice is operational: it reduced the need to place stations near existing electrical connections. In a distributed network, that can prevent infrastructure availability from becoming the de facto reason a monitoring location is chosen.
The Aernode Air Quality Monitor supports low-voltage DC operation and can be paired with the Solar Panel & Battery Kit. In this project, solar power enabled the five selected monitoring roles to be implemented without a mains connection at each point. Solar was therefore enabling infrastructure, not the monitoring objective.
Off-grid does not mean infrastructure-free. A solar-powered monitoring point still has to be designed around energy demand, solar resource, storage, communications load, seasonal conditions and tolerance for interruptions. Peer-reviewed work on solar-powered off-grid air-quality sensors documents these trade-offs directly. The transferable lesson is to size the power system for the complete monitoring point and local conditions, not only for nominal sensor consumption.
One multipollutant configuration supports consistent comparison
Each of the five nodes used the same core parameter set: PM10, PM2.5, nitrogen dioxide (NO2) and ozone (O3), together with temperature and relative humidity. Keeping the monitored variables consistent across the network makes comparison easier because the measurement question does not change from one site to another.
The parameters provide complementary context. PM10 and PM2.5 describe particulate-matter conditions across the network; NO2 adds a gas commonly associated with combustion-influenced urban environments; O3 adds a pollutant with different atmospheric behaviour; and temperature and relative humidity help contextualize changing environmental conditions. None of these variables is a source tag by itself.
That last point is the main interpretation safeguard. A higher concentration at one station than another is evidence of different observed conditions at those places and times. It is not, on its own, proof that a particular road, facility or activity caused the difference. The stronger workflow is to compare aligned periods across sites, then investigate the pattern using location, meteorology, traffic or activity information, and the known limits of the measurement system.
Comparison across sites is the value of a five-node network
The town-centre point near the road / rail crossing makes the comparison logic tangible. At the time the network was designed, the municipality treated the location as a point of interest because level-crossing closures could create traffic queues. Continuous measurements can show whether concentrations at that point vary by time of day and whether similar patterns are visible at other sites. They cannot, on their own, prove that the crossing or traffic caused a particular concentration change.
The project NO2 diurnal profile is useful in exactly this way: continuous measurements can reveal recurring temporal structure that would be hard to see in an isolated reading. The more defensible follow-up questions are whether the pattern repeats, whether it is local to one station, and what other site or meteorological context aligns with it. The profile alone does not identify the cause.
Centralized data handling turns five stations into one network
Project measurements are brought together in a common portal, allowing the municipality to review multiple locations on the same time basis rather than as separate station records. This common view is what makes spatial and temporal comparison operational: the user can examine the same variables across sites and move between current conditions and historical patterns without rebuilding the dataset point by point.
Within the Aernode ecosystem, Aernode Cloud provides the data-management layer for device supervision, storage, post-processing and secure access to current and historical monitoring information, while Aernode Reporting Tools add dashboards, historical analysis, alerts, reports and stakeholder-facing outputs. Those are system capabilities; the exact operational and public views used in a specific municipal project depend on project configuration.
Centralized handling also reduces a common interpretation problem: comparing measurements that were produced over different periods or viewed through different processing and visualization settings. A common workflow makes it easier to compare like with like – the same variables, the same period and a consistent data-management context – while still recognizing that micro-siting and local conditions can make individual stations behave differently.
The practical outcome of the architecture was not a regulatory conclusion or a source diagnosis. It was a five-point local network that could be sited more freely, measured a consistent set of variables and be reviewed as one dataset rather than as five disconnected installations.
Local monitoring adds evidence without replacing official assessment
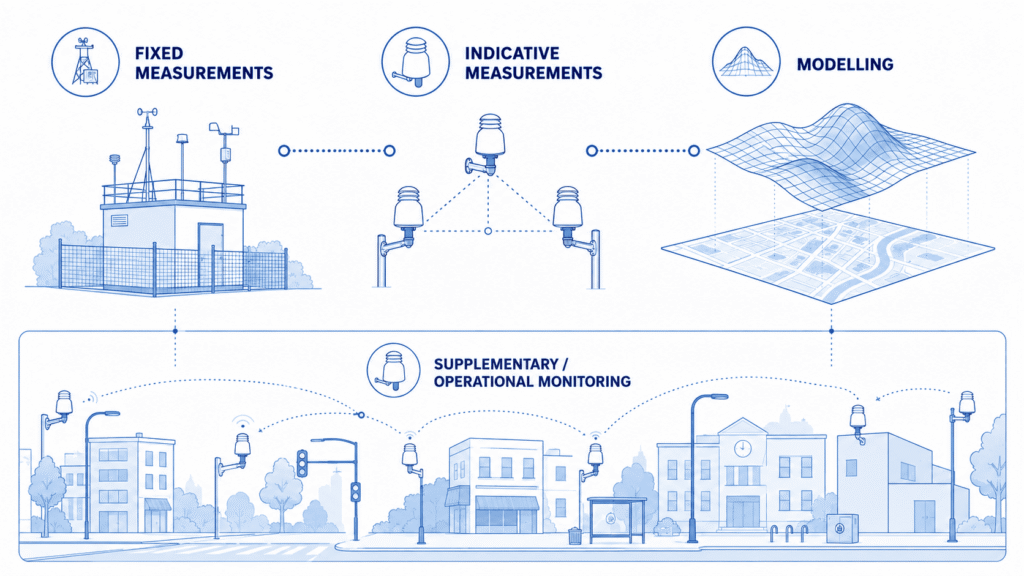
Official ambient-air assessment and a municipal local network serve different purposes. Competent authorities use prescribed assessment methods and regulatory frameworks to determine official air-quality status and compliance. The Rutigliano network adds continuous local observations in places selected for municipal interest, increasing the spatial and temporal detail available for comparison and investigation.
Directive (EU) 2024/2881 defines indicative measurement as a formal assessment category with data-quality and data-coverage requirements. This Case Study does not establish that the Rutigliano deployment has that formal regulatory role. Accordingly, the network is described here as a supplementary local evidence layer that can support comparison, investigation and communication alongside official sources.
What Rutigliano demonstrates for municipal network design
- Start with monitoring roles, not available power points. The network gains value when each location has a defined reason to be included, and autonomous power can help preserve that siting logic.
- Keep the configuration consistent when cross-site comparison is the objective. A common PM10, PM2.5, NO2, O3, temperature and relative-humidity set supports like-for-like review across locations.
- Treat differences as investigation signals, not automatic source attribution. Spatial and temporal patterns are most useful when combined with location, meteorology, traffic or activity context.
- Manage several nodes as one dataset. Centralized supervision, aligned historical views and reporting make a distributed deployment operationally easier to compare than separate station records.
- Keep the evidence boundary explicit. Local continuous monitoring can add spatial and temporal detail without replacing competent-authority assessment or independently establishing compliance.
Rutigliano demonstrates a simple but important design principle: a distributed air-quality network works best when infrastructure follows the monitoring question rather than the other way around. Five solar-powered stations allowed contrasting municipal contexts to be observed with a consistent parameter set and a common data workflow. The network still requires careful siting, power-system design, data-quality management and disciplined interpretation. For municipalities considering continuous multi-point monitoring, the transferable lesson is to define what each location must contribute first, then choose the power, connectivity and data architecture that can support those roles reliably.
Technical References
- Directive (EU) 2024/2881 on ambient air quality and cleaner air for Europe.
- European Commission Joint Research Centre – Guidance on low-cost air quality sensor deployment for non-experts based on the AirSensEUR experience (JRC130628, 2022).
- McCarron et al. – Harnessing solar to power lower-cost air quality sensors. Frontiers in Sustainable Cities (2026).