Design the network around the question the data must answer
There is no universal number of monitoring points, no universal spacing between nodes and no network density that is automatically correct. A useful air quality monitoring network begins with the decision the data must support. The number and location of monitoring points then follow from the environmental variability the project needs to resolve, the site roles that create meaningful comparisons, the pollutants and source patterns involved, and the practical ability to keep each point operating consistently.
This Guide focuses primarily on professional distributed continuous monitoring for supplementary, operational and research applications. Where network data are intended to serve a formal indicative-measurement role, the applicable assessment, data-quality and QA/QC requirements must be addressed separately. It draws on formal ambient-air network principles where they are useful, but it is not a recipe for designing a Member State statutory reference network. Formal networks have pollutant-specific legal, method, data-quality and siting requirements that must be applied in their own jurisdictional context.
The design risk is not only having too few monitors. It is having many monitors that answer the same question, sit in unrepresentative micro-environments, lose power or connectivity, cannot be serviced, or produce data that cannot be compared confidently across the fleet. Density without a measurement logic creates more data, not necessarily more understanding.
A closely related concept is spatial representativeness: what area or type of environment does a measurement stand for? The European Commission describes spatial representativeness as being at the core of setting up formal monitoring networks. A supplementary project does not automatically need to calculate a formal area of representativeness, but it should still state whether a point is intended to represent a wider background setting, a traffic corridor, a facility boundary, a receptor, a hotspot or only a very local condition. The Commission has also adopted Implementing Decision (EU) 2026/1208 setting out technical methods for modelling applications and determining sampling-point spatial representativeness; those rules apply from 30 June 2028.
| Monitoring objective | What the network must resolve | Useful site roles | Main design risk |
|---|---|---|---|
| Area / background characterisation | Conditions representative of a wider environment or population setting | Background or area-representative locations | A local source or obstruction dominates the measurement |
| Hotspot screening / spatial comparison | Where concentrations or patterns differ across the study area | Target locations plus comparison locations | Even spacing misses the gradients that matter |
| Source-adjacent / event investigation | Whether changes are consistent across time, space and meteorological context | Source-influenced, receptor and comparison locations | Correlation is treated as automatic source attribution |
| Intervention evaluation | Change at the target location relative to baseline and an appropriate comparison | Target and comparison locations over matched periods | An uncontrolled before/after difference is attributed to the intervention |
| Research / model support | A range of conditions that tests a hypothesis, model or measurement system | Stratified locations, comparison points and collocation where needed | The selected sites do not span the variability being studied |
Give every monitoring location an explicit role
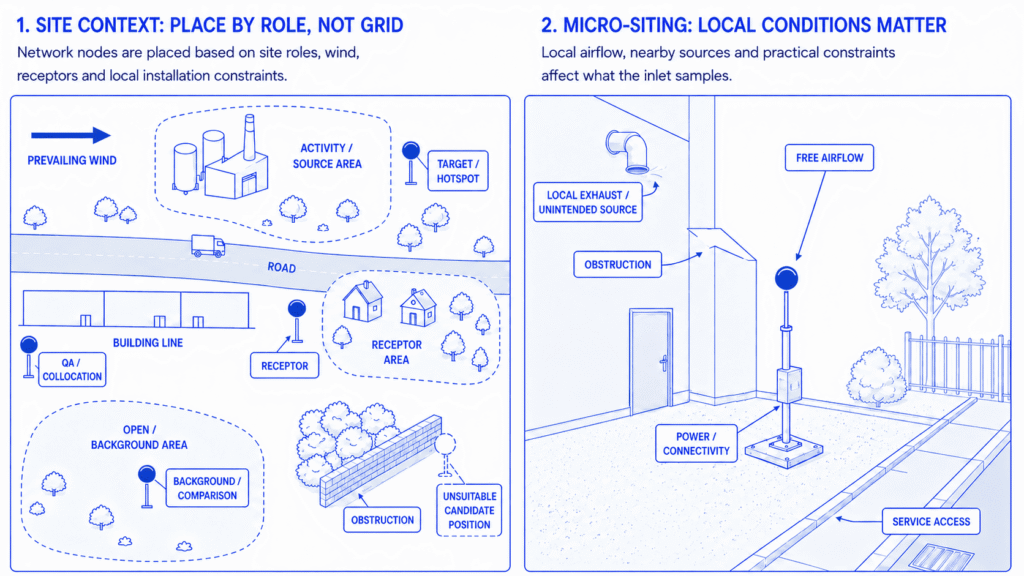
A node should not exist simply because there was room on the map. Before choosing the exact pole, roof, fence or tripod position, define the role the location must play in the comparison. That role determines what the measurement can legitimately represent and what other locations are needed around it.
Background and comparison locations
A background or comparison location provides context for interpreting another part of the network. It should be selected to represent the comparison the project actually needs: a broader area, a location less affected by the target activity, or a matched setting outside an intervention. Background does not mean “pollution-free”, and an upwind point is not automatically a true background site. Its suitability depends on other sources, land use, meteorology and the timescale of the analysis.
Target, hotspot and source-influenced locations
A target or hotspot location is deliberately chosen because the project expects a meaningful environmental contrast there. That may be a busy corridor, a site boundary, a dust-generating activity zone, a recurring complaint area or a suspected local pattern. The location is useful because it represents a defined question, not because the measurement by itself proves what caused an event.
Receptor and gradient locations
Receptor locations represent places or groups the monitoring programme needs to understand, such as nearby housing, public spaces, site boundaries or sensitive operational areas. Gradient or transect locations are used when the project needs to observe how conditions change across distance, direction or land-use type. These roles are particularly useful when one point cannot represent the spatial contrast the decision depends on.
Collocation and quality-control locations
Some network locations exist primarily to understand measurement performance rather than spatial patterns. Collocating devices with each other, or with an appropriate higher-quality measurement system when required, can reveal between-unit differences, drift and field behaviour. A network design that consumes every device in spatial coverage and leaves no practical QA strategy can be difficult to defend later.
How many monitoring points are enough?
The right node count is the number of monitoring points needed to resolve the required site roles and spatial contrasts with acceptable resilience and uncertainty — without adding redundant locations that do not answer a new question. It is not the largest number the budget can purchase, and it is not a generic stations-per-square-kilometre ratio.
Network density should increase when the study area contains more distinct environments, sharper expected gradients, multiple relevant source areas or receptors, or decisions that require stronger spatial evidence. It may be lower where the monitored environment is relatively homogeneous and a smaller number of well-chosen locations can represent the intended conditions. The decision also depends on the pollutant: a network designed around a localized traffic or source-adjacent signal is not the same as one intended to follow a broader regional pattern.
Pollutant behaviour changes the spatial scale the network must resolve
The same site geometry can require different monitoring density depending on how rapidly the target parameter is expected to vary across space. Where a pollutant or signal is strongly influenced by nearby sources, the useful contrasts may occur over short distances. The network may therefore need closer comparison between source-influenced locations, receptors and a credible background or comparison setting so that the gradient the project cares about is actually resolved.
Where a parameter is dominated more by broad urban or regional conditions, several closely spaced nodes may produce very similar information. Additional locations can still be justified for resilience, QA or a distinct land-use question, but density should not increase simply because more points are available.
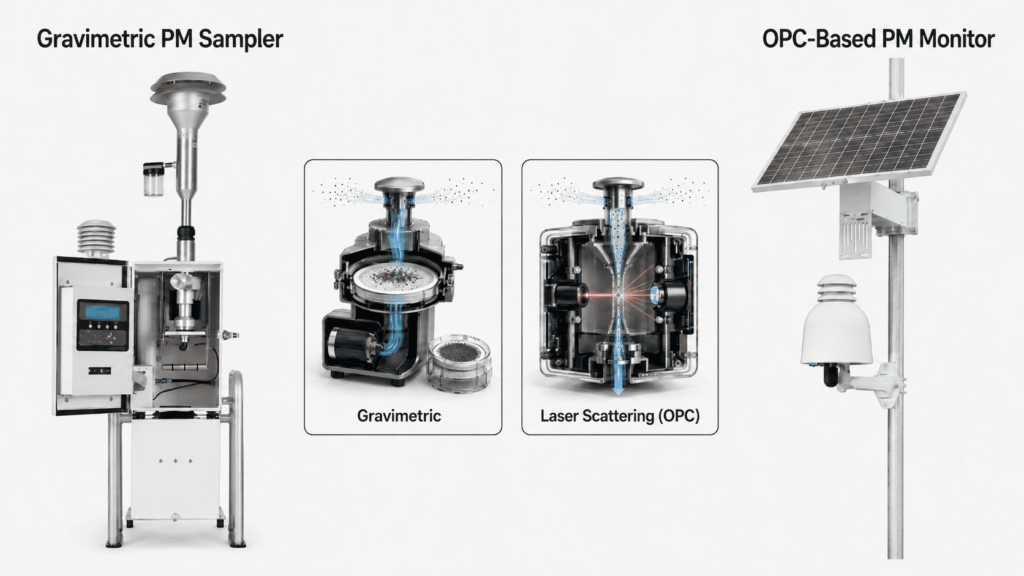
Particulate matter illustrates why this cannot be reduced to one rule. Spatial behaviour can differ with particle size, source type, resuspension and meteorology: coarse particles may respond strongly to nearby mechanical activity or surface dust, while finer particulate matter can contain a larger regional component as well as local contributions. Some reactive gases can also change over relatively short spatial and temporal scales as emissions, atmospheric reactions and transport interact. Detailed pollutant chemistry is outside this Guide; the design implication is that different parameters can require different spatial resolution even on the same site.
Node density should therefore be linked to the spatial variability the target parameter is expected to exhibit, not to a generic geographic coverage ratio.
A useful test is to ask what new question each additional node answers. Add a point when it creates a new comparison, represents a missing environment, resolves a suspected gradient, covers an important receptor, provides needed QA or reduces the risk that one device failure destroys the evidence chain. Be cautious when a proposed node merely makes the map look evenly filled.
Use a staged deployment to reduce guesswork
Where prior data or modelling are limited, an initial pilot can be more defensible than pretending the final density is knowable in advance. Deploy the first set of strategically different locations, review the observed spatial and temporal variability, then expand, move or remove points based on evidence. Highly correlated locations may be redundant for one objective but still useful for resilience or QA; consistently different locations may reveal a contrast that deserves more coverage. The reason for every change should be documented.
Use source patterns and meteorology to place the network
Air pollution is shaped by where pollutants are emitted, how those emissions vary in time, how the atmosphere transports and dilutes them, and how local geometry changes airflow. Network planning should therefore begin with a simple site model: potential source areas, transport routes, exposed receptors, background influences, terrain or building constraints, and the meteorological conditions that could change which locations are informative.
The same principle produces different layouts in different sectors. Industrial-site networks may need perimeter, source-area and receptor contrasts; construction and demolition monitoring may need a layout that evolves as active work zones move; and urban monitoring may need to distinguish traffic corridors, residential areas, background conditions and sensitive locations. A cross-sector network-design rule should therefore define the logic of the comparison rather than prescribe one geometry for every application.
Meteorology changes which locations are informative
Wind speed and direction are especially important around directional or source-adjacent questions because the same node may be downwind, crosswind or upwind at different times. A fixed label such as “upwind monitor” should therefore be treated cautiously unless the wind regime and source geometry support it. Meteorology can strengthen interpretation by showing whether an observed change is consistent with transport from a relevant area; it does not, by itself, prove source attribution.
For complex terrain, street canyons, coastal areas or large industrial sites, local flow can differ from a single regional wind measurement. The meteorological design should match the scale of the monitoring question. Where wind is central to interpretation, document where the meteorological measurement is taken, what it represents and how it will be joined to pollutant data.
Micro-siting can invalidate a good network design
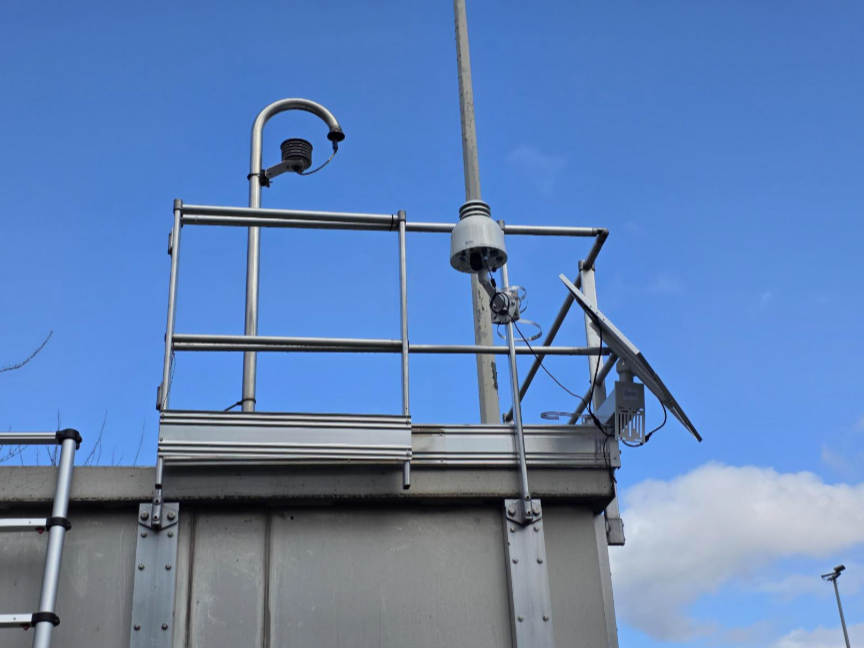
Macro-siting chooses the part of the study area a monitor should represent. Micro-siting decides exactly where the inlet sits within that area. A network can be conceptually sound and still fail at micro-siting if a device is installed beside an exhaust vent, behind a wall, inside a stagnant corner, under a dense canopy, directly above an unintended local dust source or in another position that changes the sampled air relative to the intended site role.
Before installation, check at least the following:
- Free airflow around the inlet and outlet, with no obstruction that is inconsistent with the intended measurement role.
- Nearby structures, vegetation, vents, combustion sources, dusty surfaces or other local features that could create a source or sink not intended by the study.
- Inlet height, orientation and mounting geometry relative to the measurement objective and any applicable formal siting criteria.
- Access for safe installation, inspection, cleaning, calibration or component replacement without repeatedly disturbing the setup.
- Security, tamper risk and the chance that future site changes – new fencing, growing vegetation, parked equipment or changed traffic flow – could alter the measurement environment.
For formal ambient-air assessment in the EU, Directive (EU) 2024/2881 contains detailed macro- and micro-siting requirements and states that relevant siting principles also apply when identifying locations for indicative measurements or modelling applications. Those criteria belong to the Directive framework; they should not be copied as a universal placement recipe for every supplementary sensor project. Their broader lesson is that the intended representativeness and the local exposure of the inlet must be documented deliberately.
The same distinction appears in U.S. EPA non-regulatory sensor siting guidance: the monitoring goal changes the ideal location, and practical factors such as access, power, communications, security and free airflow can determine whether a site is workable. The guidance also notes that sensor projects may legitimately use different siting choices from regulatory networks because the purposes are different. For a European audience, that is a transferable technical principle, not a U.S. regulatory rule.
Deployment constraints are part of the measurement strategy
A theoretically ideal monitoring point is not useful if it cannot stay powered, transmit data, be accessed safely or be maintained consistently. Deployment engineering therefore belongs inside network design, not after it.
Power and communications
Confirm the power architecture, expected load, autonomy requirement and recovery plan for outages before the site is approved. Where mains power is unavailable, solar and battery sizing must reflect local solar conditions, device duty cycle and communications load rather than an idealized average. Connectivity should be checked at the actual mounting position and under the network conditions expected in service.
Permissions, mounting and security
Site ownership and permissions can remove technically attractive locations from consideration. Mounting must be stable, repeatable and compatible with the inlet exposure the project needs. Security measures should protect the equipment without enclosing it so tightly that airflow is altered. The installation method should also allow future servicing without changing the monitor position unintentionally.
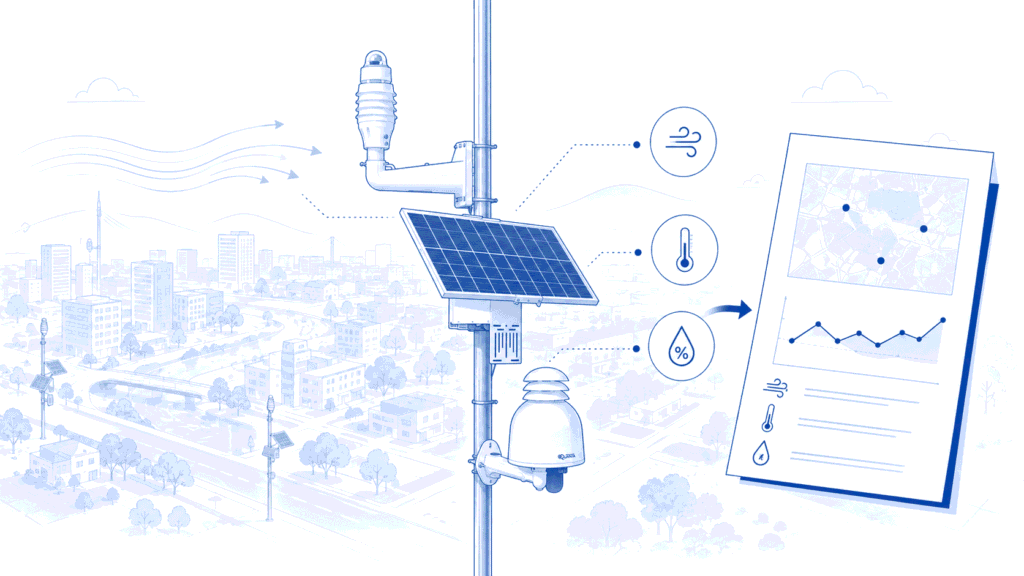
Deployment support should be selected to solve these field constraints rather than to standardize every installation. Current Aernode Accessories include meteorological sensing, solar and battery power, fixed and temporary mounting supports and local integration accessories, allowing the physical deployment to be adapted to the site.
Serviceability and lifecycle
Maintenance frequency, consumables, sensor replacement, calibration checks and physical access determine how much field effort the network will require over time. If a node can be reached only with specialist access equipment or if a power system regularly requires intervention, that burden should be visible in the design decision. Network total cost of ownership is therefore a function of operating the measurement system, not just purchasing hardware.
Treat data quality as a network property
A single device can be evaluated in isolation; a network must also preserve comparability between devices and through time. Without a network-level QA plan, differences between two locations may combine real environmental variation with sensor-to-sensor bias, changed calibration, drift, different firmware, inconsistent maintenance or missing data.
JRC guidance for managing sensor networks treats field-study design, calibration and performance assessment, QA/QC, recalibration, network operation, data management and presentation of results as connected parts of the same monitoring programme. That systems view is especially important as node count grows.
A practical network QA plan should define:
- Initial verification and, where required, collocation or comparison before wide deployment.
- Consistent device configuration, time synchronization, units, averaging periods and processing rules across comparable nodes.
- Data-quality flags, invalid-data handling and clear criteria for accepting or excluding periods from analysis.
- Routine checks for drift, contamination, changed response, power or communications problems and maintenance effects.
- A traceable record of sensor changes, calibration models, firmware, site moves, maintenance actions and other events that can affect the time series.
- A network-completeness view: uptime at one point is not enough if the comparison depends on several points operating at the same time.
This Guide does not provide a full calibration method. The design principle is narrower: decide how measurement quality will be demonstrated and maintained before the network layout is treated as final. A dense fleet with unmanaged inter-unit differences is not automatically a stronger network than a smaller fleet with clear QA and traceability.
Design the data workflow before deployment
Network design continues beyond the field hardware. The project should define how measurements become a usable dataset: acquisition and transmission frequency, timestamps and time zones, data validation, raw and adjusted data handling where applicable, storage, metadata, fleet-health information, user access, exports, analysis and reporting responsibilities.
This matters because the intended decision determines the required data workflow. An event-investigation network may need timely status information and high-resolution review. A research network may place more emphasis on metadata, raw-data access and reproducible processing. A long-term environmental-management network may prioritize continuity, consistent processing, historical comparison and structured reporting.
For Aernode deployments, Aernode Cloud provides the centralized layer for device supervision, structured data storage, calibration and post-processing management, historical records and authenticated data access. The wider design principle is platform-independent: the data architecture should be chosen at the same time as the field architecture so that the network can be operated and audited as one system.
A defensible operational chain is measurement -> quality review -> meteorological and site context -> comparison across relevant locations -> investigation -> justified action -> verification or reporting. Each transition should preserve the evidence boundary: continuous measurements can support investigation and prioritization without automatically proving causation, compliance or legal responsibility.
Use an adaptive deployment rather than a frozen layout
WMO guidance on sensor systems and networks emphasizes that sensor networks are most useful when their role is clear, performance is verified and the measurements are integrated with other relevant data sources. That supports an important design principle: the initial map should be treated as a testable hypothesis, not a permanent truth.
Review the network after enough data have been collected to understand recurring behaviour and operational weaknesses. A site may need to move because a new obstruction appears, an activity zone changes, wind patterns reveal a different comparison need, two points prove redundant, a receptor becomes more important, or a power/connectivity constraint produces repeated data gaps. A temporary campaign may deliberately rotate nodes between locations, while a long-term network may keep a stable core and use a smaller flexible layer for targeted investigation.
The important point is controlled change. Record why a site changed, when the change occurred, what new role the location is intended to play and whether the old and new time series remain comparable. Adaptation strengthens a network when it is evidence-led and documented; silent relocation weakens interpretation.
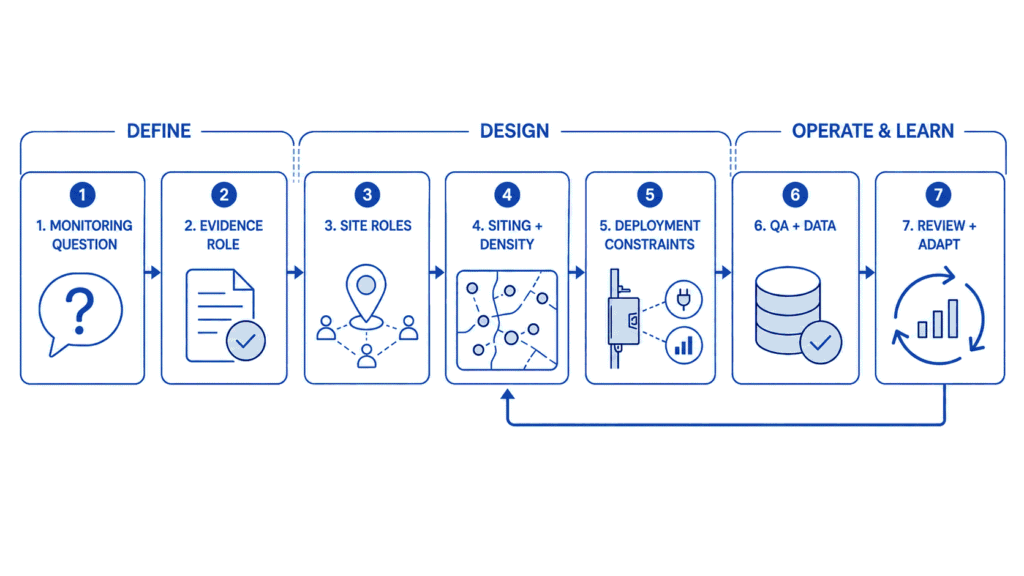
A practical air quality monitoring network design sequence
- Define the decision. Write the question the data must support and the consequence of being wrong. Separate screening, investigation, trend, intervention, research and formal-assessment objectives.
- Define the measurement role. Select the pollutants, time resolution and evidence quality needed for that decision. Do not assume every sensor or method is suitable for every role.
- Map the study area. Identify source/activity areas, receptors, roads, land use, terrain/buildings, existing measurements, likely gradients and meteorological patterns.
- Assign site roles. Specify which locations are intended as background/comparison, target/hotspot, receptor/gradient or QA/collocation points and what comparison each role enables.
- Set an initial density. Choose enough nodes to cover distinct roles and expected variability, plus any resilience or QA need. Do not use even spacing as a substitute for a design rationale.
- Verify micro-siting and deployment feasibility. Check airflow, local interferences, inlet exposure, power, communications, permissions, security, access, mounting and service requirements at each proposed location.
- Build the QA and data plan. Define verification, collocation where appropriate, configuration control, maintenance, metadata, data-quality flags, processing, storage and responsibility for network health.
- Deploy and evaluate the first network. Review data completeness, between-site differences, redundancy, unexpected local effects and whether the design is answering the original question.
- Adapt and document. Add, move or remove nodes only for a stated reason, preserve change records and revisit the design when sources, receptors, site access or the project decision changes.
If a project team cannot explain why a node exists, what environment it represents and what comparison it enables, the node is not yet part of a defensible network design.
How Aernode fits into a network-design workflow
The Aernode Air Quality Monitor is designed for continuous outdoor, multi-node deployments with configurable pollutant measurement, cellular/Wi-Fi/Modbus connectivity and support for external meteorological measurements. Those capabilities make the platform relevant when a project needs to combine field measurements with deployment-specific power, mounting and weather context rather than treat every monitoring point as an identical installation.
Aernode Cloud can supervise distributed devices, organize current and historical measurements, manage calibration and post-processing records and provide authenticated access for downstream reporting or integration. Together with field servicing and deployment accessories, this supports the operational side of network design: keeping multiple points configured, connected, traceable and maintainable over time.
The hardware platform does not determine the evidential status of a monitoring programme on its own. Whether measurements can serve a formal indicative-measurement role or contribute to regulatory assessment depends on the applicable pollutant, measurement method, achieved data quality, QA/QC, deployment and competent-authority framework. For supplementary and operational monitoring, the same discipline remains useful: define what the network can support, document its limitations and escalate to stronger or more formal evidence when the decision requires it.
What a defensible network design looks like
A well-designed air quality network does not begin with a procurement list. It begins with a clear environmental question and turns that question into a set of locations with defined roles, a justified initial density, documented siting, sustainable deployment engineering, a network-level QA plan and a data workflow that can preserve context through analysis and reporting.
The strongest designs share several characteristics:
- Every node has a stated purpose and representativeness role.
- Density is justified by the spatial questions and expected variability, not by a universal spacing rule.
- Source patterns, receptors and meteorology are built into the comparison logic without being mistaken for automatic source attribution.
- Micro-siting is documented and checked for unintended local influences.
- Power, connectivity, access, security, mounting and maintenance are treated as measurement-quality constraints.
- QA, metadata and data governance are designed for the fleet, not added after deployment.
- The network is reviewed and adapted when evidence or site conditions show that the first design can be improved.
That is the practical meaning of designing a monitoring network rather than distributing sensors: each measurement point contributes to a known comparison, and the network as a whole is capable of supporting the decision it was built to inform.
Technical References
1. Directive (EU) 2024/2881 of the European Parliament and of the Council on ambient air quality and cleaner air for Europe (recast). EU law – formal ambient-air assessment, sampling-point siting and spatial-representativeness context.
2. Commission Implementing Decision (EU) 2026/1208 of 9 June 2026. Adopted in 2026; applicable from 30 June 2028. EU law – technical rules for modelling applications and determining spatial representativeness of sampling points.
3. European Commission Joint Research Centre, JRC130050 – Guidance on low-cost sensors deployment for air quality monitoring experts based on the AirSensEUR experience. European technical guidance – network operation, calibration/performance assessment, QA/QC, data management and stakeholder presentation.
4. European Commission Joint Research Centre, JRC130628 – Guidance on low-cost air quality sensor deployment for non-experts based on the AirSensEUR experience. European technical guidance – study design, verification, network design, quality control and data use.
5. U.S. Environmental Protection Agency – A Guide to Siting and Installing Air Sensors. U.S. non-regulatory technical guidance – used for transferable sensor siting and installation principles.
6. U.S. Environmental Protection Agency – The Enhanced Air Sensor Guidebook (2022). U.S. non-regulatory technical guidance – monitoring-study planning, setup, collection, evaluation and sensor performance.
7. World Meteorological Organization, GAW Report No. 293 – Integrating Low-Cost Sensor Systems and Networks to Enhance Air Quality Applications (2024). International technical guidance – distributed sensor networks, verification and integration with other air-quality data sources.