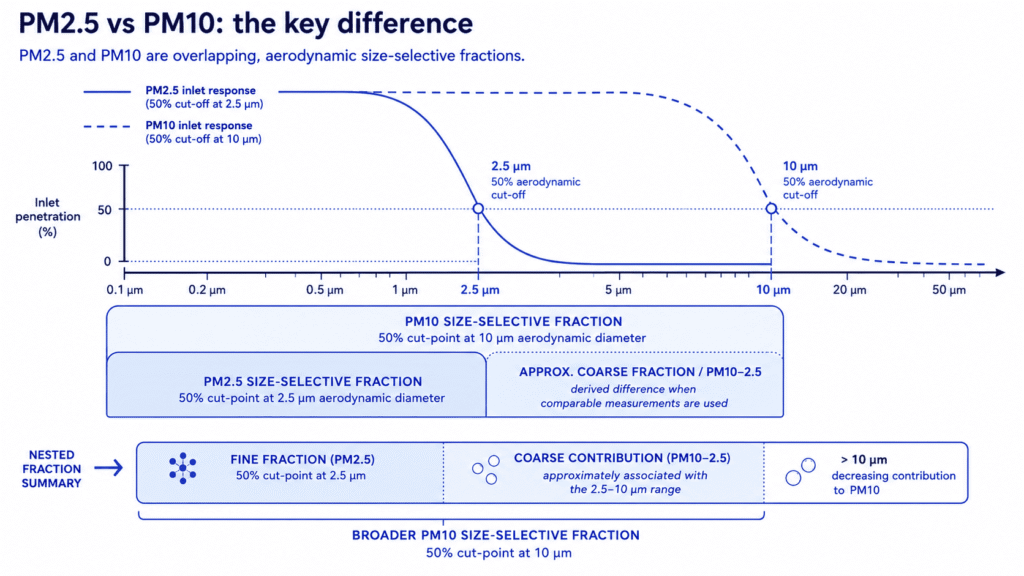
PM2.5 and PM10 are not two different pollutants in the chemical sense. They are two overlapping particle-size fractions used to describe airborne particulate matter. In European ambient-air assessment, Directive (EU) 2024/2881 defines them through size-selective sampling: PM2.5 uses a 50% efficiency cut-off at 2.5 micrometres aerodynamic diameter, while PM10 uses the same concept at 10 micrometres. Conceptually, PM2.5 represents the finer part of the broader PM10 size range, while PM10 also captures a larger contribution from coarser particles.
That distinction matters because particle size affects how particulate matter is generated, transported and measured. A project focused on combustion and secondary aerosol, construction dust, road resuspension or a mixed industrial environment may need a different emphasis. The useful question is therefore not “Which PM number is better?” but “Which fraction, or combination of fractions, answers the monitoring objective – and can the chosen measurement method support that interpretation?”
PM2.5 vs PM10: the key difference
PM2.5 is the fine particulate fraction conventionally associated with an aerodynamic cut-off of 2.5 micrometres. PM10 is a broader fraction with a 10 micrometre cut-off. Both fractions are normally reported as mass concentrations, typically in µg/m³; the number in the name describes the size-selective fraction, not the concentration level. Because PM10 spans both fine and coarser particle sizes, the two values are related rather than independent. In a well-behaved paired measurement, PM2.5 normally forms part of the reported PM10 mass, but the formal sampling definitions are penetration curves rather than perfect sieves.
| Characteristic | PM2.5 | PM10 |
|---|---|---|
| Formal size-selective definition | 50% efficiency cut-off at 2.5 µm aerodynamic diameter | 50% efficiency cut-off at 10 µm aerodynamic diameter |
| What the fraction emphasises | Fine particles | Fine particles plus a larger coarse-particle contribution |
| Common source emphasis | Combustion-derived particles and secondary aerosol are often important; natural and mechanical sources can still contribute | Adds stronger visibility of mineral dust, resuspension, sea salt and other mechanically generated particles; combustion and secondary PM remain part of the fraction |
| Typical environmental pattern | Can have an important regional/background component while still responding to local sources | Can show stronger local and episodic coarse-particle effects, although long-range mineral dust and other regional contributions also occur |
| Useful monitoring questions | Fine-aerosol trends, combustion/secondary influence, background comparison | Dust-generating activity, resuspension, coarse events and mixed particulate conditions |
| Formal EU reference method | EN 12341:2023 gravimetric method | EN 12341:2023 gravimetric method |
Particle size is an aerodynamic definition, not a chemical identity
The micrometre values in PM2.5 and PM10 should not be read as a simple ruler measurement of every particle. Ambient particulate fractions are defined using aerodynamic behaviour: particle density, shape and settling characteristics influence how a particle behaves in a size-selective inlet. A dense irregular mineral particle and a lower-density particle with the same geometric width can therefore have different aerodynamic diameters.
The 2.5 µm and 10 µm values are also 50% efficiency cut-offs, not hard gates that pass everything below the number and reject everything above it. Size-selective inlets have collection-efficiency curves around the nominal cut-off. This is why the shorthand “PM2.5 sits inside PM10” is useful for interpretation, but it is not a literal description of two perfect sieves.
For some analyses, the difference between co-located PM10 and PM2.5 is used as an estimate of the coarse fraction, often written PM10-2.5. That can be informative when the two measurements are comparable, but subtraction combines the uncertainty of both values. With compact optical instruments, separate PM fractions may also be generated by the same particle-counting and mass-conversion model, so the difference should not be treated as an independent source measurement.
Why PM2.5 and PM10 can tell different environmental stories
Particle size is linked to how material enters the atmosphere and how long it remains suspended, but the relationship is not one-to-one. A monitoring result becomes more useful when the fraction is interpreted together with likely processes, meteorology, background conditions and other measurements.
Fine particles: combustion and secondary aerosol often matter more
PM2.5 in European ambient air can receive important contributions from combustion, industry and transport, as well as from secondary particulate formation from gaseous precursors. Fine particulate matter can therefore include both local and regional contributions, while agricultural ammonia can contribute indirectly through secondary particulate formation where relevant.
This means a sustained PM2.5 elevation can reflect a mixture of local emissions, regional background and atmospheric chemistry. A high value does not by itself identify a nearby source, and a low local-activity level does not guarantee that fine particulate concentrations will be low.
Coarse particles: dust, resuspension and mechanical processes become more visible
The broader PM10 fraction can include substantial contributions from mineral dust, resuspension, sea salt and other mechanically generated particles, alongside the fine particulate already contained within the broader fraction. This makes PM10 especially useful where the monitoring question involves material handling, construction activity, road resuspension, brake and tyre wear or other coarse-particle processes.
Coarse particulate events can be highly local and sensitive to wind, surface dryness and short-duration activities. They can also be transported over longer distances – Saharan dust is an obvious European example – so a PM10 increase should not automatically be assigned to the closest visible activity.
The source categories overlap
It is tempting to turn the fractions into a simple rule: PM2.5 equals combustion and PM10 equals dust. That is too strong. Combustion sources can contribute to PM10 because the fine fraction is part of the broader measurement. Mechanical processes can also generate some fine material, and atmospheric ageing can change particle size and composition.
For environmental monitoring, the fractions are therefore indicators of particle-size behaviour, not source fingerprints. Source attribution requires additional evidence such as wind direction, activity records, comparison locations, gaseous co-pollutants, chemical analysis or modelling, depending on the question.
How to interpret PM2.5 and PM10 together
When both fractions are available from a consistent monitoring setup, their relationship can add context that neither value provides alone. The strongest interpretation is usually based on patterns over time rather than one isolated ratio.
Using the PM2.5/PM10 ratio and coarse fraction
Two derived indicators can add useful context when PM2.5 and PM10 are measured together: the PM2.5/PM10 ratio and the approximate PM10–2.5 coarse fraction. They describe different aspects of the same particle-size relationship and are most useful when their changes are followed over time.
PM2.5/PM10 ratio
The PM2.5/PM10 ratio expresses how much of the reported PM10 mass is represented by the finer PM2.5 fraction.
- Higher ratio: the measured particulate mass is relatively more weighted toward the fine fraction.
- Lower ratio: the coarse contribution within PM10 is relatively more important.
The ratio is most useful comparatively – during an event, between periods or across comparable monitoring locations – rather than as an isolated value or a universal source threshold. It can vary with season, meteorology, regional or background aerosol, local source mix and atmospheric processes, and can become unstable or misleading when concentrations are very low.
Approximate coarse fraction
PM10–2.5 ≈ PM10 − PM2.5
When PM2.5 and PM10 measurements are sufficiently comparable, their difference can provide an estimate of the coarse contribution within PM10.
- PM10 rises strongly while PM2.5 changes relatively little: the estimated coarse contribution increases and the PM2.5/PM10 ratio tends to decrease.
- PM2.5 rises broadly in step with PM10 and the ratio remains high or increases: the particle-size mix contains a relatively stronger fine-fraction contribution.
Neither pattern identifies a source by itself.
How to use these indicators
Their main value is diagnostic and comparative rather than classificatory. Interpretation is strongest when absolute PM2.5 and PM10 concentrations, ratio changes and the estimated coarse contribution are examined together with temporal evolution, meteorology, spatial comparison where multiple monitoring points are available, operational information and background conditions. A sudden ratio change during a PM event can therefore justify checking whether the particle-size mix has changed, especially when supported by wind, rainfall, site activities or differences between monitoring locations.
With compact optical instruments, PM2.5 and PM10 may also be derived from the same underlying particle-counting measurement and mass-conversion model. Their ratio and difference should therefore be treated as related derived indicators rather than independent measurements, with interpretation remaining dependent on instrument performance, aerosol characteristics, calibration or verification, QA/QC and environmental conditions.
- Compare like with like. Use the same averaging period, time alignment and quality-control status before comparing PM2.5 with PM10.
- Review persistence and spatial pattern. Determine whether the change is short-lived or persistent and whether it appears at one monitoring point or across multiple locations.
- Use supporting evidence. Wind, rainfall, humidity, site logs, traffic conditions, background/reference measurements and other pollutants can turn a particle-size pattern into a defensible investigation lead.
The practical objective is not to force every event into a fine-versus-coarse label. It is to use the two fractions to decide what should be checked next: another location, a site activity, meteorology, a reference comparison, a laboratory analysis or a more formal source-specific investigation.
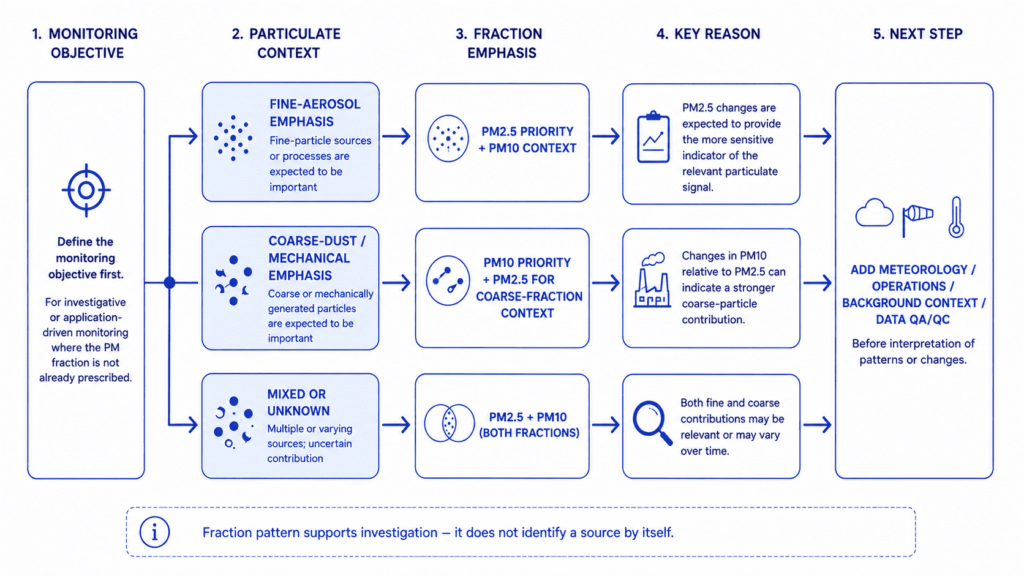
Which fraction should an environmental monitoring project prioritise?
The answer depends on the environmental question. Many projects benefit from retaining both fractions when the selected instrument already reports multiple PM channels, because the additional size information can improve interpretation without requiring a separate monitoring point or instrument. The table below is a decision aid, not a universal specification.
| Monitoring objective | Useful PM fraction(s) | Why | Interpretation caution |
|---|---|---|---|
| Construction and demolition monitoring | PM10 priority; PM2.5 useful context | PM10 is important for coarse mineral dust and resuspension; PM2.5 shows the fine component and helps separate a coarse-dominated event from a wider particulate increase. | Do not equate PM10 with site dust automatically; background, traffic, wind and regional events still matter. |
| Urban areas and traffic monitoring | PM2.5 + PM10 | Traffic environments combine combustion-related, secondary and non-exhaust/mechanical particulate. Both fractions help describe the mix. | Roadside concentration does not prove vehicle-source attribution; street geometry, background and meteorology affect the signal. |
| Industrial perimeter / mixed processes | Usually both; prioritise by process | Industrial sites can combine combustion, material handling, vehicle movement and external background. The monitoring objective should determine the emphasis. | Review process knowledge and meteorology before assigning a measured change to plant operations. |
| Urban or regional background / trend context | PM2.5 often central; retain PM10 when coarse or natural contributions matter | Fine aerosol can have an important regional component and is widely used for long-term ambient assessment; PM10 adds information on coarse and natural events. | A background site still needs representative siting and an appropriate measurement method. |
| Short-event investigation with uncertain particle character | Both if practical | Simultaneous fractions help determine whether an event is predominantly fine, coarse or mixed and guide the next investigation step. | Fraction pattern is screening evidence, not causal proof. |
Measurement method matters as much as the size fraction
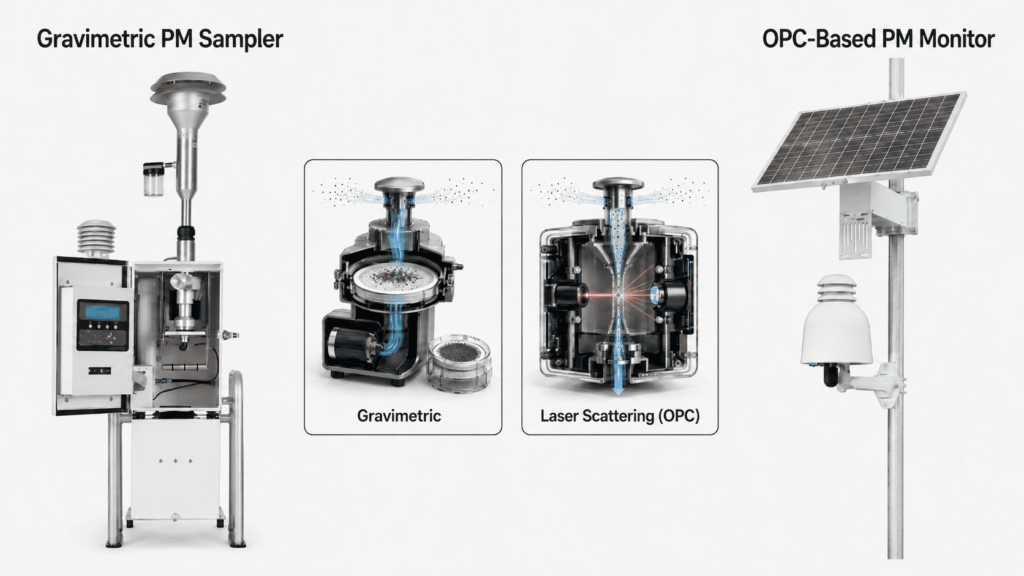
A PM2.5 or PM10 label does not, by itself, tell you how the value was measured or how much confidence it can support. Under the EU ambient-air framework, the reference method for both fractions is the EN 12341:2023 gravimetric method. It collects size-selected particles on a filter and determines mass over a defined sampling period.
Continuous optical particle counters take a different route. They detect light scattered by individual particles, estimate optical size, count particles and convert the particle-size distribution into an estimated mass concentration. That allows fast PM2.5 and PM10 time series, but the result depends on aerosol properties, humidity, sampling-path design, airflow and the instrument’s conversion and calibration approach. The OPC vs Gravimetric Particulate Matter Measurement Guide explains that distinction in more detail.
For continuous sensor-based monitoring, sensor selection, field design, calibration, performance assessment and data management should be treated as parts of the same measurement system. Choosing PM2.5 rather than PM10 is only one layer of the monitoring decision: instrument performance, QA and field context determine whether the resulting data are fit for purpose.
This is particularly relevant when one compact monitor reports several PM fractions from the same optical measurement. The channels are useful, but they are not separate reference analyses. A project should verify that the instrument is suitable for the expected aerosol and environmental conditions, especially where coarse mineral dust or high humidity are material concerns.
How Aernode supports continuous PM monitoring
Aernode uses Optical Particle Counter (OPC) technology for continuous particulate matter monitoring. The Aernode Air Quality Monitor can be configured with different particulate sensor models according to project requirements rather than using one universal OPC configuration for every deployment.
Different OPC models should not be treated as interchangeable. Different particulate sensor models can offer different particle-size measurement capabilities, reported PM fractions, environmental operating ranges, expected service life and field-performance characteristics. The appropriate configuration should be selected based on the monitoring objective, required PM fractions, expected aerosol and concentration range, environmental conditions, deployment duration, maintenance strategy, required measurement performance and the project’s data-quality objectives.
Depending on configuration, Aernode can provide multiple particulate fractions, including PM10 and PM2.5. The Aernode Sensor Kits architecture allows sensing assemblies to be configured and serviced independently, supporting project-specific sensor selection without replacing the complete monitoring station.
Multi-fraction particulate information can support event analysis, comparison between locations and interpretation of whether a particulate change is predominantly fine or includes a stronger coarse contribution. It does not identify a source by itself, and it does not remove the need for project-specific calibration, verification and QA/QC. Continuous optical PM measurements are not automatically equivalent to the regulatory gravimetric reference method.
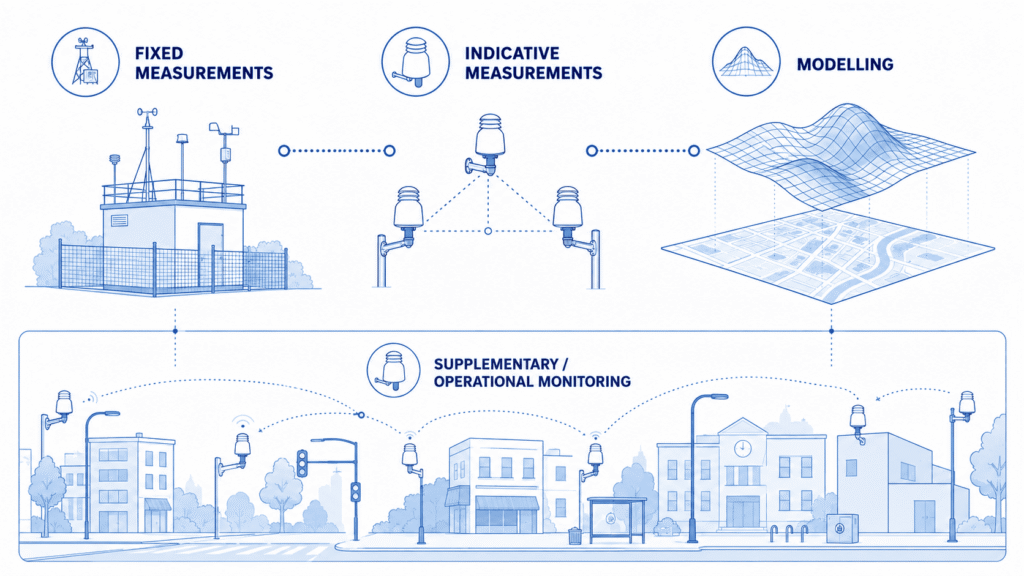
Aernode is designed for continuous supplementary monitoring. Where measurements are intended to serve a formal indicative-measurement role, the applicable method, data-quality objectives, QA/QC and assessment framework must be addressed separately.
The monitoring question should decide the fraction
PM2.5 and PM10 are two different windows into the same atmospheric particle population. PM2.5 emphasises the fine fraction; PM10 broadens the view to include a larger coarse-particle contribution. Neither fraction is universally more informative.
Before specifying a project, answer six questions:
- What decision must the particulate data support?
- Are the likely particle-generating processes predominantly fine, coarse or mixed?
- Would measuring both PM2.5 and PM10 materially improve interpretation?
- Does the required evidence role call for a reference method, continuous event visibility, distributed spatial coverage, or a combination?
- Is the selected instrument characterised for the expected aerosol, humidity and outdoor operating conditions?
- What meteorological, operational, background or source-specific evidence will be needed to interpret a change responsibly?
For a project dominated by coarse dust, PM10 may deserve greater operational emphasis. For a question centred on fine aerosol, PM2.5 may deserve greater emphasis. In many real environmental programmes, measuring and interpreting both is the most useful approach because it turns a single particulate number into a more informative particle-size context. The decisive step is to define the monitoring question first, then select the fraction, method and evidence workflow that can answer it.
Technical References
2. Air quality status report 2026 – Particulate matter (PM2.5). European Environment Agency.
3. Air quality status report 2026 – Particulate matter (PM10). European Environment Agency.4. Guidance on low-cost air quality sensor deployment for non-experts based on the AirSensEUR experience. European Commission Joint Research Centre, JRC130628.