Industrial sites

Air quality monitoring for industrial sites

Industrial sites generate complex and variable emission profiles that cannot be understood through periodic sampling alone.

Aernode provides continuous, multi-pollutant monitoring across site boundaries and operational areas, creating structured data for day-to-day oversight, event investigation, documented response and environmental reporting workflows.

Operational air quality monitoring

Continuous insight for proactive emission management

Continuous operational monitoring shows how air quality changes across the site during day-to-day operations, making short-lived events, recurring patterns and emerging deviations visible as they occur. Used alongside periodic measurements and regulatory sampling, it adds the continuous, high-frequency context that those methods cannot provide between campaigns, without replacing their formal role.

With nodes positioned along the site perimeter and around relevant operational areas, the network helps relate air-quality changes to plant activity and local meteorology, investigate abnormal events and complaints, and act before emerging issues become harder to manage. It creates a persistent layer of environmental oversight for individual facilities and multi-site operations.

Operational value

Operational value of continuous air quality monitoring

A high-frequency network complements scheduled sampling and regulatory monitoring with continuous visibility across day-to-day site operations.

01

Continuous monitoring across the site

A distributed network provides a permanent monitoring presence across the facility, revealing short peaks and recurring patterns that periodic campaigns may not capture.

02

Proactive communication with communities and stakeholders

Continuous site data builds an internal evidence base, relating observed conditions to meteorology and plant activity so teams can explain events, respond to concerns and communicate proactively with external stakeholders.

03

Active monitoring with configurable alerts

Configurable thresholds and alerts highlight deviations linked to process upsets, loading, maintenance or equipment faults, helping teams investigate and respond before conditions escalate.

04

Clearer identification of hotspots and plume pathways

Perimeter and source-area nodes show where conditions change and how pollutants move, supporting more targeted inspections, maintenance and mitigation.

05

Structured data for ESG and management reporting

Consistent time-series records strengthen environmental governance, sustainability disclosures and comparison across sites or reporting periods.

Monitoring network deployment

A monitoring network designed around your site

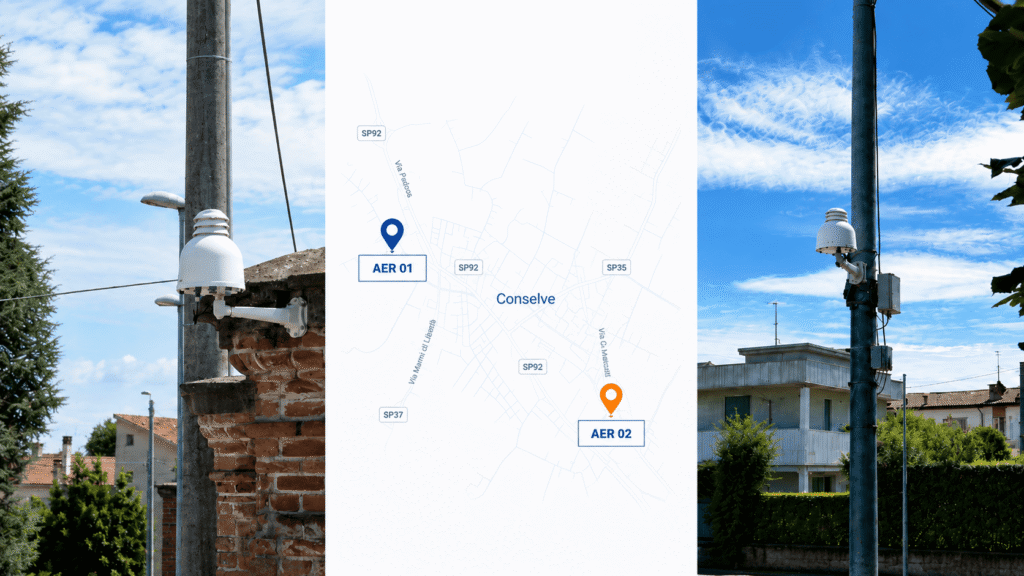
Each deployment is configured around the facility layout, relevant emission sources, exposed receptors and the operational questions the monitoring network must answer.
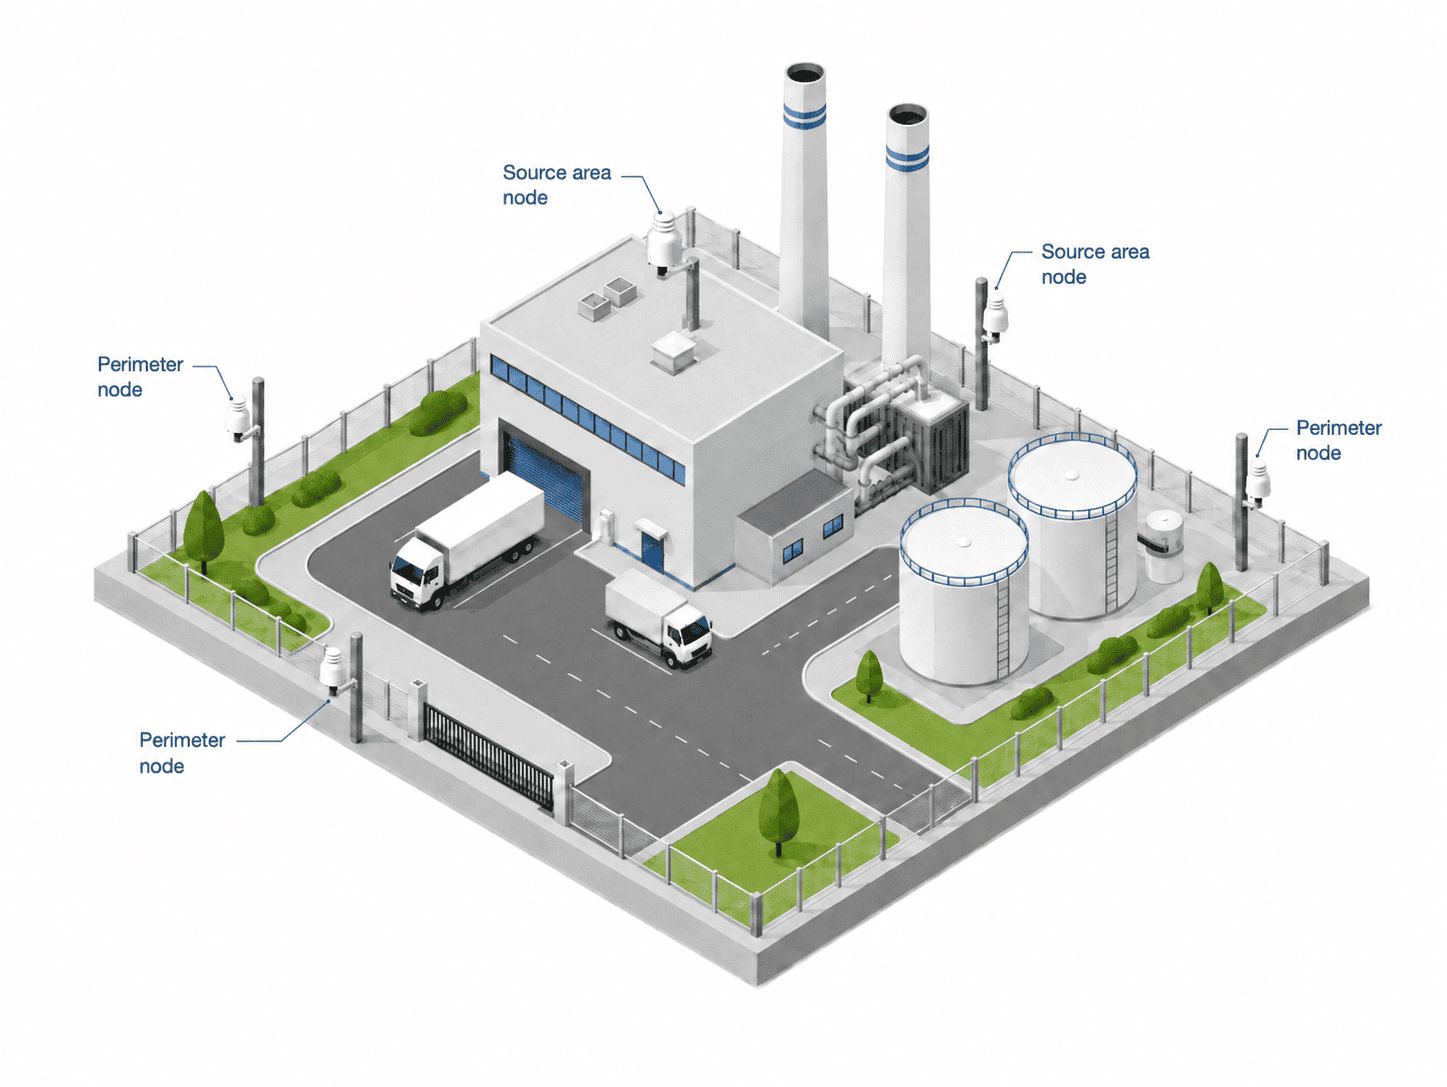
Illustrative industrial site showing perimeter and source-area placement of Aernode monitoring nodes
01

Define the monitoring objectives

Establish what the network must explain, from boundary conditions and recurring emission patterns to source-area events, abnormal episodes and stakeholder concerns.

02

Configure and position the network

Select pollutants, meteorological measurements and node locations according to source areas, prevailing winds, exposed receptors and site access conditions.

03

Establish the operational workflow

Connect measurements to dashboards, alerts, investigation procedures and reporting outputs so that site teams can use the network as an ongoing operational tool.

Key pollutants

Pollutants commonly monitored across industrial sites

Pollutant Why it matters on industrial sites
PM₂.₅ / PM₁₀ Particulate matter
Generated by material handling, crushing, stockpiles, unpaved roads and internal traffic. Distributed PM monitoring helps identify dust peaks, understand local variations and assess how operational activities affect conditions across the site and at its boundary.
VOCs Volatile organic compounds
Associated with solvents, coatings, chemical storage, fuel handling and process releases. Continuous VOC monitoring supports the detection of changing conditions around source areas and the investigation of odour or emission events.
SO₂ Sulphur dioxide
Associated with the combustion of sulphur-containing fuels and selected industrial processes. Continuous monitoring helps identify variations around boilers, furnaces and process areas, relate peaks to operating conditions and assess how concentrations change across the site and at its boundary.
H₂S Hydrogen sulphide
Relevant around effluent systems, wastewater processes, waste streams and other decomposition-related sources. Even short variations can be important when investigating odour complaints and relating events to plant activity and wind conditions.
NO₂ / NOx Nitrogen dioxide and nitrogen oxides
Produced by generators, combustion equipment, vehicles and diesel-powered internal logistics. Monitoring helps review conditions around loading areas, transport routes and other operational zones affected by combustion sources.
CO Carbon monoxide
Emitted by incomplete combustion and vehicle engines. Continuous area monitoring is particularly relevant in enclosed or semi-enclosed operational areas where exhaust concentrations may change with traffic and ventilation.
NH₃ Ammonia
A project-specific parameter for facilities involving water treatment, refrigeration, chemical handling or agro-industrial processes. It can provide useful context for both operational events and odour-related investigations.

Aernode supports more than 20 compatible parameters; each station uses a project-specific sensor configuration, while the table shows the options most commonly selected for industrial sites.

Solution stack

Explore the Aernode Components

Aernode air quality monitor
Field monitoring hardware

Aernode Monitors

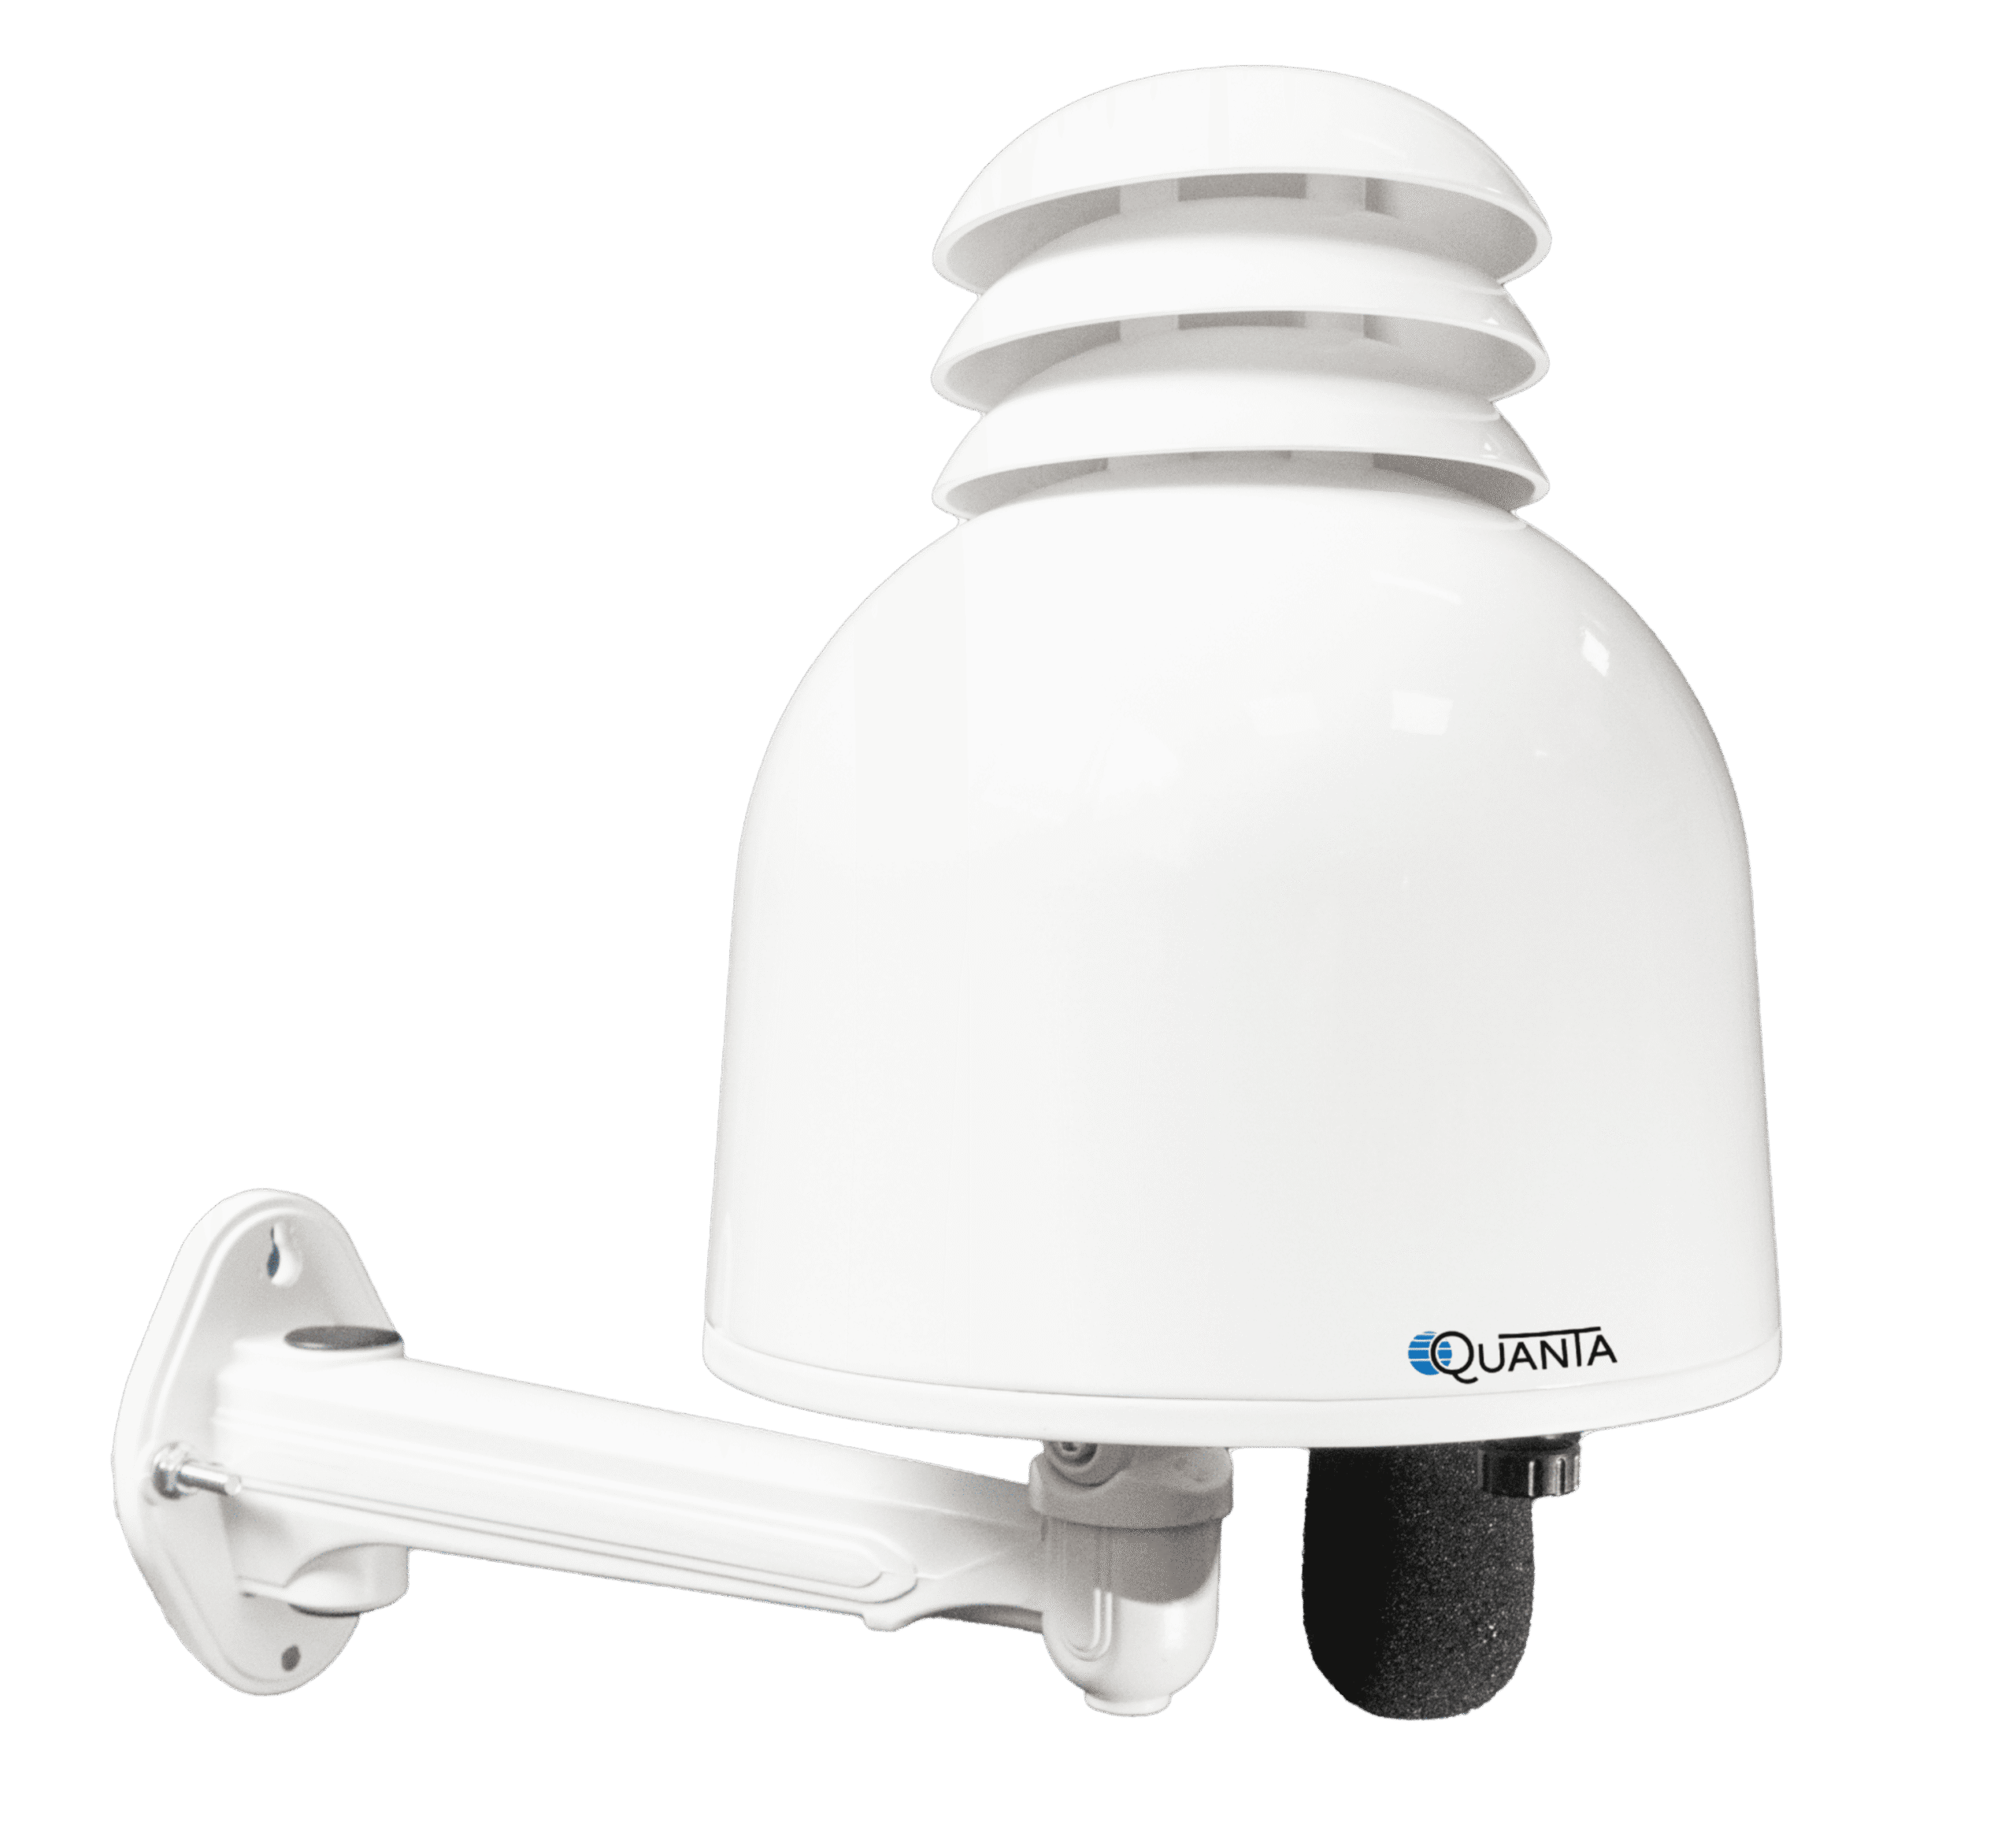
Configurable outdoor stations for continuous measurement of particulate matter, gaseous pollutants and environmental conditions across distributed monitoring networks.

  • Site-specific pollutant configurations
  • Continuous outdoor data acquisition
  • Designed for single-site and multi-node networks

Explore Aernode Monitors
Aernode Cloud
Data infrastructure

Aernode Cloud

A central environment for device supervision, data storage, post-processing and secure access to current and historical monitoring information.

  • Remote network and device management
  • Historical records and data continuity
  • Authenticated integration through APIs
Explore Aernode Cloud
Aernode Sensor Kit
Modular sensing assemblies

Sensor Kits

Preconfigured sensing assemblies that simplify pollutant selection, field servicing and configuration updates throughout the operating life of the network.

  • Modular pollutant combinations
  • Efficient field replacement
  • Configuration tailored to project requirements
Explore Sensor Kits
Aernode reporting tools
Dashboards and reporting outputs

Reporting Tools

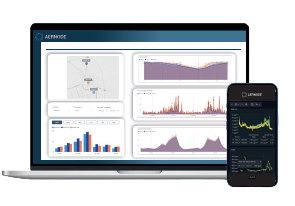
Digital environments for current conditions, historical analysis, automated outputs and communication with internal teams or external stakeholders.

  • Real-time and historical dashboards
  • Threshold alerts and scheduled reports
  • Private and stakeholder-facing environments
Explore Reporting Tools
Aernode deployment accessories
Deployment accessories

Accessories

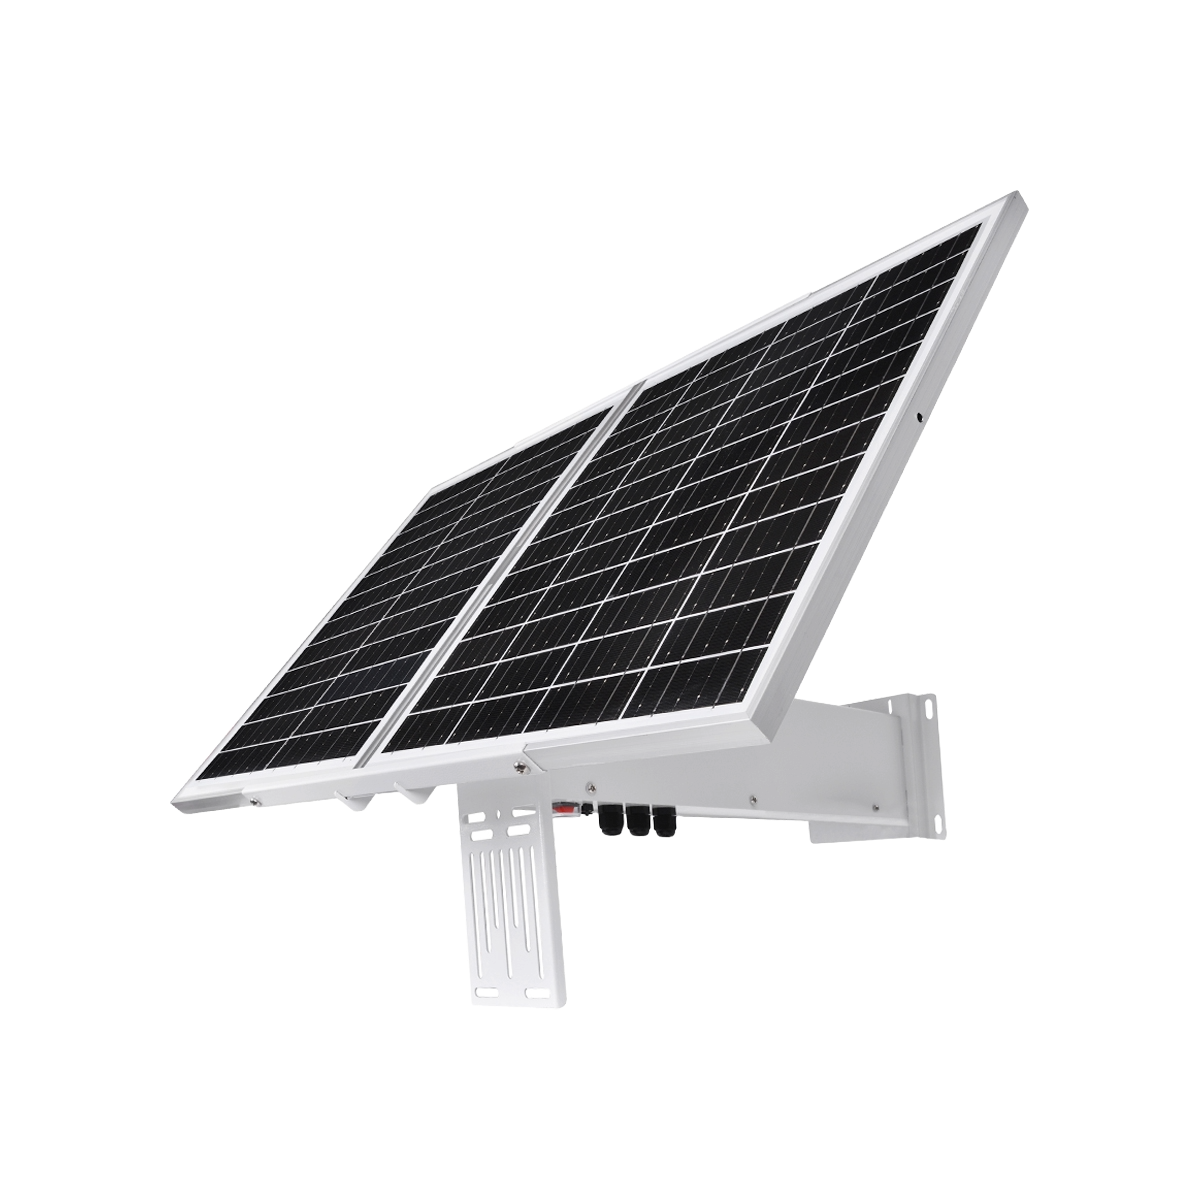
Power, meteorological, mounting and connectivity options for fixed-site, perimeter and off-grid monitoring configurations.

  • Weather stations and anemometers
  • Solar power and autonomous deployment options
  • Mounting and connectivity accessories
Explore Accessories
Industrial monitoring configuration

Plan an air quality monitoring network for your industrial site

Define the right sensor configuration, node placement, connectivity option and reporting workflow for your industrial monitoring project.