
Monitoring volatile organic compounds can mean very different things. A laboratory method may identify individual compounds and quantify them separately. A direct-reading instrument may provide a broad response to a group of compounds. A compact continuous sensor may provide a relative indicator or a broad calibration-equivalent response, depending on the sensing technology. These outputs are not interchangeable, even when a dashboard labels them all as VOC or TVOC.
The first question is therefore not which VOC sensor is better, but what information the monitoring project actually needs. A project looking for recurring events may only need a stable relative signal. A project screening short-term changes may benefit from a fast broad response in concentration units. A project that must identify benzene, characterize an unknown mixture or produce method-specific evidence needs a different level of chemical information.
This Guide maps those evidence levels first, then focuses on two compact continuous sensing approaches relevant to Aernode: metal-oxide sensing, often described as MOX or MOS, and photoionization detection, or PID. A MOX sensor produces a broad chemiresistive response that can be processed into an index or other derived output depending on the implementation. A PID provides a calibration-dependent broad response to compounds that its ultraviolet lamp can ionize. Neither technology provides chemical speciation by itself.
What can VOC monitoring actually tell you?
Relative change and event patterns
At the most operational level, VOC monitoring can answer questions such as: did the volatile-gas response increase, when did the change begin, how long did it last, did it recur under similar operating conditions, and was the pattern seen at one monitoring point or several? This is relative information. It can be highly useful for event detection, temporal comparison and investigation even when the instrument cannot identify the compounds responsible.
Broad concentration-like VOC information
Some direct-reading instruments provide a broad VOC signal expressed in concentration units. The number is more quantitative in form than an index, but its meaning still depends on the sensing principle and calibration basis. A PID, for example, reports the response of compounds that its lamp can ionize relative to a calibration gas. For an unknown mixture, that value should be treated as a calibration-equivalent broad response rather than as a chemically complete total of every VOC present.
Compound-specific identification and quantification
The highest level of chemical specificity is needed when the question is which compounds are present and how much of each is present. Targeted sampling and analytical methods can separate compounds before detection, allowing individual VOCs to be identified and quantified according to a defined method. This evidence role is fundamentally different from a broad sensor response. The greater specificity usually comes with a more complex sampling, analytical and quality-assurance workflow.
The monitoring objective determines which evidence level is sufficient. More chemical specificity is not automatically better for every project, and continuous coverage is not automatically better than a targeted analytical result. The useful method is the one that produces evidence fit for the decision.
Main approaches to VOC measurement
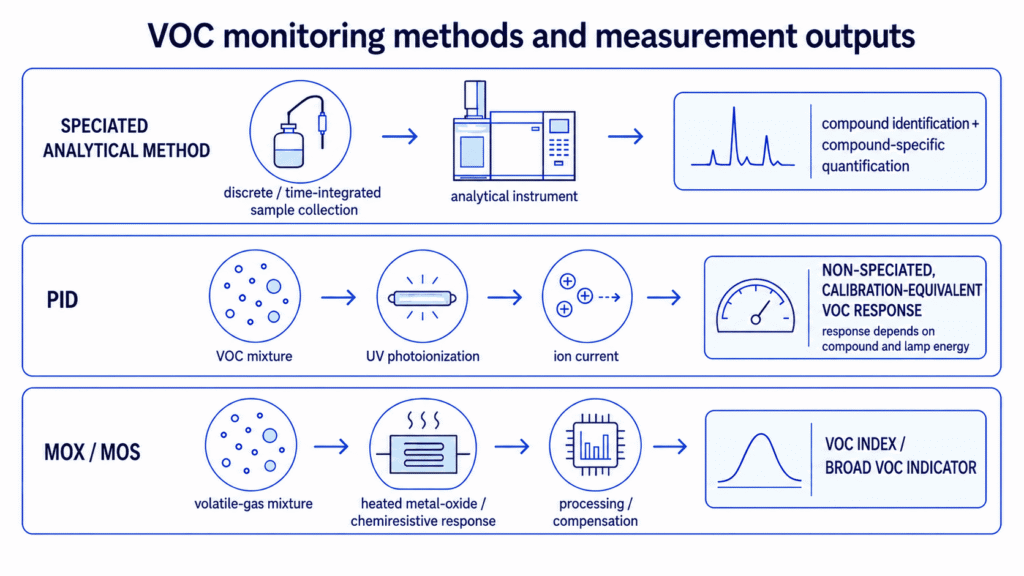
VOC measurement methods can be grouped by their measurement principle and the kind of evidence they produce rather than by a simple “high-end versus low-cost” hierarchy.
| Measurement approach | Typical principle / example | Typical output | Chemical specificity | Typical monitoring role |
|---|---|---|---|---|
| Targeted / analytical methods | Defined sampling + gas chromatography / GC-MS or other target-specific analytical method | Compound identity; individual concentrations; method-defined sums | High where the method is designed for the relevant compounds | Speciation; compound-specific quantification; formal evidence where required |
| Photoionization detection – PID | UV photoionization | Broad calibration-equivalent VOC response | Broad / non-specific without prior compound knowledge or selective separation | Rapid screening; event monitoring; continuous broad VOC response |
| Metal-oxide sensing – MOX / MOS | Chemiresistive metal-oxide response + signal processing | Broad sensor response; VOC / TVOC Index depending on implementation | Broad / non-specific | Continuous trends; recurring events; distributed monitoring; relative comparison |
These are not the only VOC measurement technologies available. They are the principal approaches needed to establish the measurement landscape for this Guide; MOX and compact PID are the two continuous sensor technologies examined in detail because they are relevant to Aernode.
Targeted analytical methods prioritize compound information. Defined sampling and analytical procedures can identify or quantify individual VOCs and method-defined sums when the method is designed for those compounds. Their evidence role is chemical specificity, with a deployment and QA model that differs from broad continuous sensing.
PID provides a fast, broad and calibration-dependent response to compounds that the selected UV lamp can ionize. It can support rapid screening, event monitoring and continuous broad VOC measurement, but it does not identify an unknown mixture by itself.
MOX / MOS sensing produces a broad chemiresistive response that can be processed into a relative VOC or TVOC Index, depending on the implementation. It is well suited to continuous trends, recurring events and distributed comparison when relative broad-response evidence is sufficient. PID and MOX therefore support different evidence roles without implying a universal better-or-worse hierarchy.
Where compact continuous VOC sensors fit
Compact VOC sensors are valuable when the monitoring question benefits from many measurements rather than a small number of chemically detailed samples. Compact field hardware can reduce space, power and infrastructure requirements; continuous acquisition can reveal event timing; and multiple monitoring points can make spatial comparisons practical. These characteristics are useful for perimeter monitoring, temporary investigations and distributed environmental networks.
The term “low-cost VOC sensor” is often used broadly for compact sensor-based approaches with substantially lower hardware and deployment requirements than complex analytical instrumentation. It should not be interpreted as a measurement-performance class: two compact VOC sensors can provide fundamentally different outputs, sensitivity, selectivity and evidence quality.
That deployment advantage comes with a clear trade-off: lower infrastructure burden does not mean equivalent chemical information. A network of broad-response sensors may show that conditions changed at 14:20 and that the change was stronger at one boundary location than another, while still being unable to identify the responsible compounds. A targeted laboratory method may identify and quantify compounds precisely, while providing much less temporal continuity.
For compact sensor-based monitoring, the monitoring purpose, expected concentration range, operating environment and data-quality needs should be defined before the sensing technology is selected.
MOX sensing and processed VOC Index outputs
Metal-oxide gas sensors use a heated sensing material whose electrical resistance or conductance changes as gases interact with the surface. The response is chemiresistive rather than a direct count of VOC molecules. Its magnitude depends on the sensing material and operating conditions, the composition of the gas mixture, interfering gases and environmental factors such as temperature and humidity.
Electronics and software can then compensate, filter and transform that broad response into a more usable output. One common implementation in compact air-quality systems is a processed VOC or TVOC Index. The measurement chain is therefore best understood as: MOX sensor response -> compensation / processing -> VOC or TVOC Index.
An index can be very useful when the objective is comparative. It can show that the broad volatile-gas response rose, fell or recurred under similar site conditions; it can support trend tracking across time; and, after appropriate characterization, it can add an event channel to a multi-point monitoring network.
The number should not be interpreted as a direct molecule count or as a universal VOC concentration. VOC Index scales, baseline logic and processing algorithms are implementation-specific. An index value should therefore be interpreted according to the sensing system and algorithm that produced it, not as a universal VOC concentration scale.
This is not simply an “accuracy” limitation. It is a different measurement architecture. Two mixtures can produce similar broad sensor responses while having different chemical composition, and the same mixture can produce a different response as environmental conditions, baseline history or sensor condition change. Calibration, compensation and field verification must therefore be designed around the actual implementation and intended use.
PID sensors and broad VOC measurement
A photoionization detector draws sampled air into a measurement cell containing an ultraviolet lamp. When a molecule absorbs enough photon energy to be ionized, it releases an electron and forms an ion. The resulting ion current is measured and converted into a reported VOC response. The method is fast and broad rather than chemically selective.
Lamp energy and detectable compounds
The lamp energy creates a fundamental detection boundary. A compound contributes to the PID signal only if the photon energy is sufficient to ionize it. A commonly used 10.6 eV lamp responds to many VOCs, but not all of them. Low-molecular-weight compounds such as methane are familiar examples that do not respond to a 10.6 eV PID. Different lamp energies change the set of compounds that can contribute.
A PID is therefore not an “all VOC” detector. It is also not a speciation instrument. In a mixture, the signal is the combined response of the compounds that are ionized by the selected lamp, weighted by their different sensitivities. Fast response is a practical strength for event screening, but the chemical scope of the measurement must remain explicit.
Isobutylene-equivalent readings and response factors
A PID requires a defined calibration basis. Isobutylene is widely used as a PID calibration gas. If the instrument is calibrated to isobutylene and the sample composition is unknown, the displayed value should be understood as an isobutylene-equivalent broad response, not as the true sum of every VOC molecule in the air.
PID sensitivity varies by compound and lamp. A response factor relates the response of a particular VOC to the response of the calibration gas. When one target compound is known and the mixture is sufficiently characterized, the appropriate response factor can support a corrected estimate for that compound. In an unknown or changing mixture, however, one response factor cannot resolve the signal into chemical speciation.
Environmental conditions can also affect PID field response. Temperature and relative humidity, particularly more extreme or high-humidity conditions, can influence measurement response and the transferability of a calibration. Continuous deployments should therefore verify PID performance under the expected operating conditions rather than assume that a calibration established under different environmental conditions remains unchanged.
This makes a PID output concentration-like, but not automatically compound-specific. The number remains conditional on lamp energy, calibration gas, response factors and mixture composition.
Why “TVOC” does not mean the same thing across methods
TVOC is not a sensor technology, and it is not a universally identical measurand across instruments. The label can sit on top of very different measurement architectures. Before comparing two “TVOC” values, the user needs to know how each was generated.
Analytical or method-defined TVOC
An analytical method can define a total or integrated VOC metric from a specified sampling and analytical procedure. The result is bounded by the compounds, retention window, detector response, calibration and calculation rules defined by that method. It is a method-defined quantity, not a generic property that every VOC instrument measures in the same way.
PID broad VOC output
A PID reports a calibration-equivalent broad response from compounds that its selected lamp can ionize. It can be expressed in concentration units, but the result is conditioned by the calibration gas and compound-dependent sensitivity. An unknown mixture therefore remains an unknown mixture.
MOX-derived VOC / TVOC Index
A VOC or TVOC Index derived from MOX sensing is a processed broad-response output. The scale, baseline and algorithm are implementation-specific, so an index point is not interchangeable with a ppm or mg/m³ value and should not be compared as if it were a universal total concentration.
Two dashboards labelled “TVOC” can therefore report fundamentally different quantities. The correct interpretation starts with the measurement principle, unit, calibration basis and processing logic, not the dashboard label.
MOX vs PID: what is the practical difference?
Once the broader VOC measurement landscape is clear, the MOX-versus-PID comparison becomes more useful. In the MOX implementation discussed here, the broad sensor response is processed into a VOC Index, while PID provides a calibration-equivalent broad VOC response. Both can support continuous event and trend monitoring, but they produce different kinds of evidence and carry different interpretation risks.
| Question | MOX sensing | PID |
|---|---|---|
| Physical response | Change in resistance / conductance of a heated metal-oxide sensing element as gases interact with the surface. | Ion current produced when an ultraviolet lamp ionizes responsive compounds in sampled air. |
| Typical output | Processed VOC / TVOC Index or another implementation-dependent broad-response output. | Broad VOC reading in concentration units under a defined calibration basis. |
| What the number means | Relative / processed intensity according to the sensing system and algorithm. | Calibration-equivalent response to the mixture of compounds that the lamp can ionize. |
| Chemical selectivity | Broad and implementation-dependent; different compounds and interferents can produce different responses. | Broad and non-selective across ionizable compounds; response varies by compound and lamp energy. |
| Chemical speciation | No. A single broad index does not identify the VOCs present. | No. A PID signal alone does not identify the compounds producing the response. |
| Strong use case | Tracking changes, recurring patterns or event timing when a relative indicator is sufficient and the site relationship is understood. | Fast screening of ionizable VOC changes when a concentration-like broad signal is useful for comparison or investigation. |
| Main interpretation risk | Treating an index point as a universal concentration or assuming different products use the same index definition. | Treating an isobutylene-equivalent mixture response as a true total concentration or as a specific compound without supporting information. |
Which VOC monitoring approach fits the question?
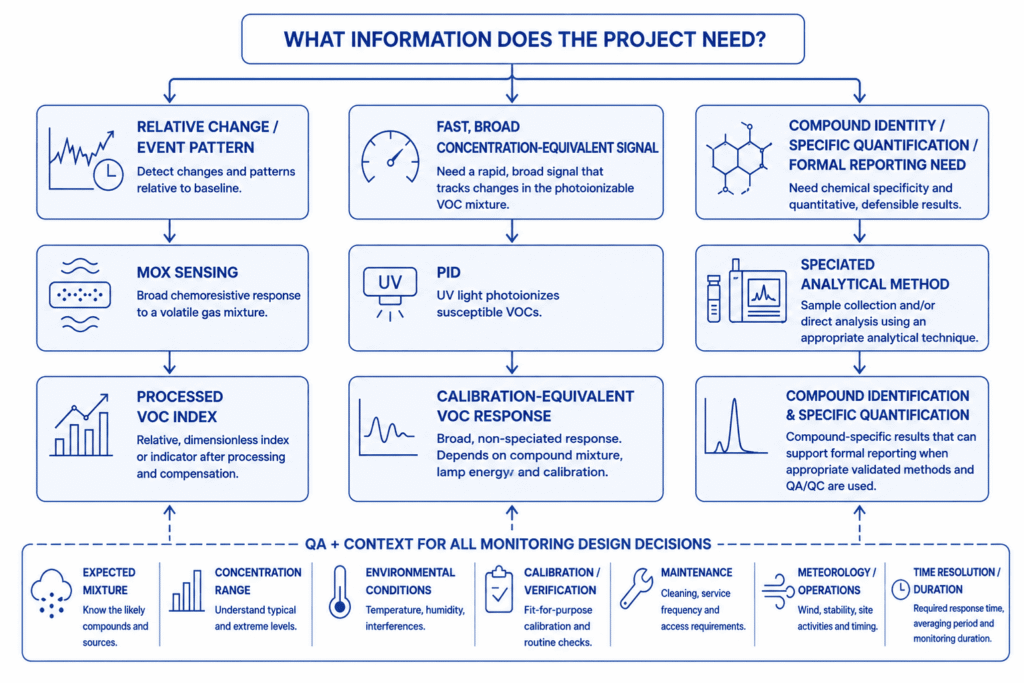
The central selection question is: what information must the data support? Three routes cover most environmental-monitoring decisions addressed by this Guide.
Route 1 – Relative change / event pattern: MOX sensing can be appropriate
Use MOX sensing when the project mainly needs to detect increases and decreases, recurring patterns, event timing or relative differences between comparable periods or monitoring locations. A processed VOC Index can be useful when distributed continuous coverage matters and a chemically specific concentration is not required.
The QA plan should still address baseline behaviour, temperature and humidity, sensor history, drift, local background and the consistency of the processing algorithm. Thresholds should be project-specific investigation triggers rather than universal chemical limits unless they have been validated for a defined application.
Route 2 – Fast broad concentration-like VOC signal: PID can be appropriate
Use PID when rapid response and a broad magnitude in concentration units are useful for screening or investigation. The calibration basis must be known, the expected mixture should be compatible with the lamp response, and the user should understand which compounds may contribute strongly, weakly or not at all.
A PID can strengthen event interpretation when a fast time series is needed, but an isobutylene-equivalent reading should not be re-labelled as a specific compound or a chemically complete total without supporting information.
Route 3 – Compound identity / specific quantification / formal evidence: use a targeted analytical method
Move to targeted or analytical methods when the decision depends on identifying the compounds present, quantifying an individual compound, characterizing an unknown mixture chemically, or meeting a legal, permit, contractual or method-specific evidence requirement. A broad index or generic PID signal is not a substitute for that evidence role.
Whichever route is selected, document the expected VOC mixture and concentration range, environmental conditions, calibration or verification strategy, maintenance requirements and the meteorological or operational context needed to interpret events. The same sensor can be useful in one evidence role and inadequate in another.
VOC signals in odour and environmental investigations
A VOC signal is not an odour measurement. Human odour perception depends on which odorants are present, their concentrations, interactions in the mixture and the sensitivity of the receptor. A broad VOC response cannot reproduce that perception or prove that a reported odour originated from a particular source.
Broad VOC measurements can still be useful context. In industrial sites, wastewater treatment plants and landfills and waste treatment sites, continuous signals can help establish event timing, compare periods or locations, and review whether a change coincided with wind direction, site operations or other measured gas indicators.
The defensible workflow is therefore signal -> context -> investigation, not signal -> automatic source attribution. Where odour is the central issue, VOC data should be combined with the wider investigation method appropriate to the site and question.
When targeted analytical methods are required
Targeted analytical methods become necessary when broad response is no longer enough. Air can be collected using a method appropriate to the target compounds and analysed with separation techniques such as gas chromatography, with detector selection matched to the analytical objective. GC-MS is commonly used when chemical identification is required because separation and mass-spectral information can distinguish compounds that a broad sensor would combine into one response.
This does not mean every VOC project needs laboratory analysis. A sensor network may be entirely fit for purpose when the question is event timing, relative change or broad screening. Analytical work becomes important when the monitoring decision moves from “something changed” to “which compound changed, by how much, and according to which defined method?”
Formal benzene evidence is a separate measurement role
For European ambient-air assessment, Directive (EU) 2024/2881 specifies EN 14662 as the reference method for sampling and measuring benzene in ambient air. A broad VOC Index or generic PID reading should therefore not be presented as automatically equivalent to formal benzene reference measurement. Where a project requires compound-specific formal evidence, the appropriate targeted or reference method must be selected independently.
Sensor price is not the same as measurement cost
The purchase price of the sensing element is only one part of the cost of producing useful VOC information. Calibration, verification, environmental compensation, drift management, sensor replacement, PID lamp servicing, cleaning, maintenance, QA review and data interpretation can all contribute to lifecycle measurement cost.
This matters particularly when comparing compact technologies. A relatively inexpensive sensing element does not automatically produce the lowest-cost monitoring programme if maintaining a stable, decision-useful output requires extensive characterization or repeated verification. Conversely, a more service-intensive sensor can be justified when its output matches the evidence requirement more directly.
The relevant comparison is therefore fit for purpose plus the total effort required to maintain the needed measurement quality over the intended deployment life. No technology is universally cheapest once measurement quality, servicing and interpretation are included.
How Aernode supports continuous VOC monitoring
Aernode supports two distinct sensing approaches for continuous VOC monitoring: MOX and PID. The MOX-based channel provides a processed output reported by Aernode as T.VOC Index, supporting relative trend and event interpretation. Configurable PID sensing provides a fast broad VOC response in concentration units under a defined calibration basis.
Within the Aernode Air Quality Monitor, the Core Sensor Board can include the MOX-based sensing channel, whose processed output is reported as T.VOC Index, while configurable Aernode Sensor Kits can add PID-based VOC sensing through the Sensor Deck. The two channels are treated as different measurement options because their outputs support different questions rather than interchangeable ways of reporting the same quantity.
The appropriate configuration depends on the information the project needs, expected VOC mixture and concentration range, environmental conditions, calibration strategy, servicing requirements and intended evidence role. MOX sensing is suited to relative trend and event context when that is sufficient, with T.VOC Index interpreted as the processed broad-response output. PID is suited to a broad concentration-like response when the lamp and calibration basis fit the expected mixture. Targeted analytical methods remain the appropriate path when chemical identity or compound-specific evidence is required.
Aernode is designed for continuous supplementary environmental monitoring. Where measurements are intended to serve a formal indicative-measurement role, the applicable method, data-quality objectives, QA/QC and assessment framework must be addressed separately. Where compound-specific formal evidence is required, the appropriate targeted or reference method must be selected independently.
Choose the evidence first, then the sensing technology
VOC monitoring is not one measurement. Relative indexes, calibration-equivalent broad signals and compound-specific analytical results answer different questions even when they appear under similar VOC or TVOC labels.
A strong monitoring design therefore starts by defining the evidence the project needs. Use MOX sensing when relative changes and event patterns are the useful evidence, with the resulting processed VOC Index interpreted as a broad-response indicator. Use PID when a fast broad concentration-like response is needed and the calibration and lamp response are understood. Use targeted analytical methods when chemical identity, individual concentrations or formal method-specific evidence are required.
That sequence keeps the technology in its proper role: measurement objective -> evidence level -> sensing or analytical method -> QA and context -> interpretation. It is a more defensible starting point than asking which VOC sensor is “best” in the abstract.
Technical References
1. European Commission Joint Research Centre – Review of Portable and Low-Cost Sensors for the Ambient Air Monitoring of Benzene and Other Volatile Organic Compounds (JRC106535).
2. U.S. Environmental Protection Agency – The Enhanced Air Sensor Guidebook (2022).
3. Matthew P. Stewart, Paul E. Ohno, Karena McKinney and Scot T. Martin, “Prediction of the Response of a Photoionization Detector to a Complex Gaseous Mixture of Volatile Organic Compounds Produced by α-Pinene Oxidation,” ACS Earth and Space Chemistry, 2023, 7(10), 1956–1970. DOI: 10.1021/acsearthspacechem.3c00054.
4. European Parliament and Council – Directive (EU) 2024/2881 on ambient air quality and cleaner air for Europe – Annex VI benzene reference method (EN 14662).
5. Christopher C. Coffey, Ryan F. LeBouf, Larry Lee, James Slaven and Stephen Martin, “Effect of calibration and environmental condition on the performance of direct-reading organic vapor monitors,” Journal of Occupational and Environmental Hygiene, 2012, 9(11), 670–680. DOI: 10.1080/15459624.2012.725015.