Why continuous monitoring changes what you can investigate
A wastewater treatment plant is continuously changing: process loads, sludge handling, storage activities, maintenance and meteorological conditions can alter what is observed around different areas of the site. A periodic inspection or a measurement collected after an event cannot necessarily reconstruct what happened earlier. Continuous environmental monitoring adds a persistent record that operators can review before, during and after changing conditions.
The practical value is not simply more sensor readings. It is the combination of measurements across relevant process areas and boundaries, meteorological context, plant activity, event or complaint records, historical data, alerts and documented follow-up. Used together, these elements make environmental conditions more observable and later investigations more evidence-based. The same record also provides a documented framework for how environmental changes, events and follow-up are systematically monitored and reviewed.
This Guide covers continuous ambient environmental monitoring around process areas, site boundaries and relevant receptor pathways. It does not cover occupational exposure, confined spaces, liquid/process instrumentation, direct odour measurement, formal source-emission measurement or automatic source attribution.
Why add a continuous monitoring layer when it is not required?
Where a permit or authority does not specifically require a continuous distributed environmental network, an operator may still choose to add one as an additional environmental management layer. Its value is the persistent, time-aligned record: what environmental conditions were being measured, what changed and when, which locations were affected, and what meteorological or operational conditions were present.
When a complaint, regulator question, municipality enquiry or community concern arises, the operator is therefore not starting from an empty record. It can review measurements, alerts, site context, the investigation that followed, any action taken and whether conditions changed afterwards. That makes environmental management more systematic and reviewable rather than purely reactive.
Environment Agency guidance for permitted sites in England requires auditable monitoring records, advance consideration of how results will be interpreted, documented decision-making, complaint investigation and records of remedial measures. It also advises operators, where possible, to recognise problems through observations or monitoring rather than wait for complaints. Those requirements are specific to permitted activities in England; the transferable management principle is that monitoring becomes more useful when records, interpretation and follow-up are defined in advance.
Used this way, a continuous network can support environmental-management credibility and more transparent, evidence-based dialogue with regulators, municipalities and neighbouring communities by showing that environmental issues are observed and reviewed through a defined process. It does not prove compliance, prove the absence of environmental impact, guarantee community acceptance or replace any applicable permit requirement.
Define the monitoring objective before choosing the network
A continuous network can support several environmental objectives, but the design should not assume that one layout, parameter set or alert logic serves them all. Each measurement should connect to a stated decision, a defined interpretation and an appropriate follow-up.
| Monitoring objective | What continuous data can add | Interpretation safeguard |
|---|---|---|
| Continuous environmental oversight | A persistent record around relevant plant areas and boundaries, exposing changes or recurring patterns that occasional measurements may miss. | A change is evidence to review, not proof of a cause. |
| Event / odour-complaint investigation | Time-aligned measurements that can be reviewed with meteorology, node location and plant activity after a reported event. | Chemical measurements do not directly measure perceived odour. |
| Configurable operational alerts | Prompts to inspect conditions, compare nodes or review activities when selected parameters change. | An alert is not automatically an odour, health or regulatory threshold. |
| Recurring-pattern analysis | Comparison across operating periods, wind sectors, seasons and recurring activities. | Patterns generate hypotheses; they do not establish causality by themselves. |
| Mitigation / operational follow-up | Before/during/after evidence around an operational or mitigation change. | Weather and activity can confound simple before/after comparisons. |
| Perimeter / receptor context | Spatial comparison from process areas to boundary and, where justified, receptor-oriented locations. | Gradients and wind compatibility support interpretation but do not prove source attribution. |
| Documentation / reporting | Structured historical evidence for internal environmental management, complaint follow-up and appropriate stakeholder communication. | Reporting scope should match the purpose, data quality and applicable formal requirements. |
The objective should determine what the network needs to observe, where each node sits, which contextual records must be retained and what action is reasonable when the data change.
What should a wastewater monitoring network measure?
There is no universal wastewater parameter package. Select measurements from the process areas, environmental questions and expected conditions at the site. The most useful network is usually the smallest configuration that can answer the defined questions with enough spatial and contextual information.
| Parameter | What it can add | Where it may be relevant | Important limitation |
|---|---|---|---|
| H2S / hydrogen sulphide | Time-resolved information on a gas commonly relevant to wastewater and odour-related conditions. | Selected process or sludge areas, boundary points and event investigations where H2S is plausible. | Not direct odour measurement; low-concentration performance and cross-sensitivity matter. |
| NH3 / ammonia | A second gas indicator where treatment or sludge activities make ammonia relevant. | Site-specific treatment, sludge handling or storage contexts. | Usefulness is process-specific; do not treat NH3 as a universal wastewater proxy. |
| VOC indicator / PID | Broad context on changing volatile conditions and mixed volatile emissions. | Sites or activities where volatile compounds are a defined monitoring concern. | A broad VOC signal does not identify every compound or equal odour concentration. |
| PM10 / PM2.5 | Ambient-air and dust context around traffic, material handling, drying or other dust-generating site activity. | Internal roads, handling areas, boundaries where particulate conditions matter. | Particulate matter is not an odour measurement. |
| Wind speed / direction | Transport and pathway context for comparing locations under changing conditions. | Network-wide interpretation; especially process-to-boundary and boundary-to-receptor questions. | Wind compatibility is not source proof; local flows can be complex. |
| Temperature / RH | Environmental context and support for sensor-quality interpretation. | Across the monitoring network, particularly where sensor response is environmentally sensitive. | Context variables do not by themselves explain a concentration change. |
A peer-reviewed field study of environmental treatment facilities used continuous NH3, H2S and TVOC sensor data to examine time-varying conditions. That kind of multi-parameter approach is most useful when each parameter has a reason to be in the programme, rather than when pollutant count is treated as a goal in itself.
H2S is useful, but the monitoring objective determines how it should be used
Hydrogen sulphide is frequently a useful wastewater indicator, particularly around relevant anaerobic, septic or sludge-related conditions, but its relationship with odour and its usefulness as an indicator are site-specific. A wastewater-specific H2S study found that H2S fate and emissions in the studied extended-aeration plant varied with wastewater and operating conditions including aeration, H2S loading, pH and temperature. The finding illustrates process dependence; it is not a universal wastewater emission model.
H2S concentration is not a direct measurement of human odour perception. Wastewater odour can involve multiple compounds, and H2S should not be treated as a universal odour proxy. Environment Agency odour-impact guidance for England describes important limitations of instrumental and surrogate approaches, while a WWTP study in Spain combined H2S measurements, wind variables and olfactometry as distinct lines of evidence.
At very low ambient concentrations, compact electrochemical H2S sensors used for continuous environmental monitoring operate in a region where baseline stability, cross-sensitivity, temperature and humidity effects, and general measurement uncertainty can become significant relative to the signal being investigated. This does not define a universal detection boundary, odour threshold or technology limit; it means that quantitative interpretation should become more cautious as the environmental signal approaches the scale of field uncertainty.
For this reason, continuous H2S measurements are often most useful as one line of time-resolved evidence: showing when conditions changed, whether an episode persisted, whether several nodes changed, whether a pattern repeated, and whether it coincided with wind or plant activity. Where the decision requires precise low-level quantification, direct odour characterisation, formal confirmation or compound-specific laboratory analysis, the continuous network should guide and support the appropriate confirmatory method rather than replace it.
Design the network around observation roles, not uniform spacing
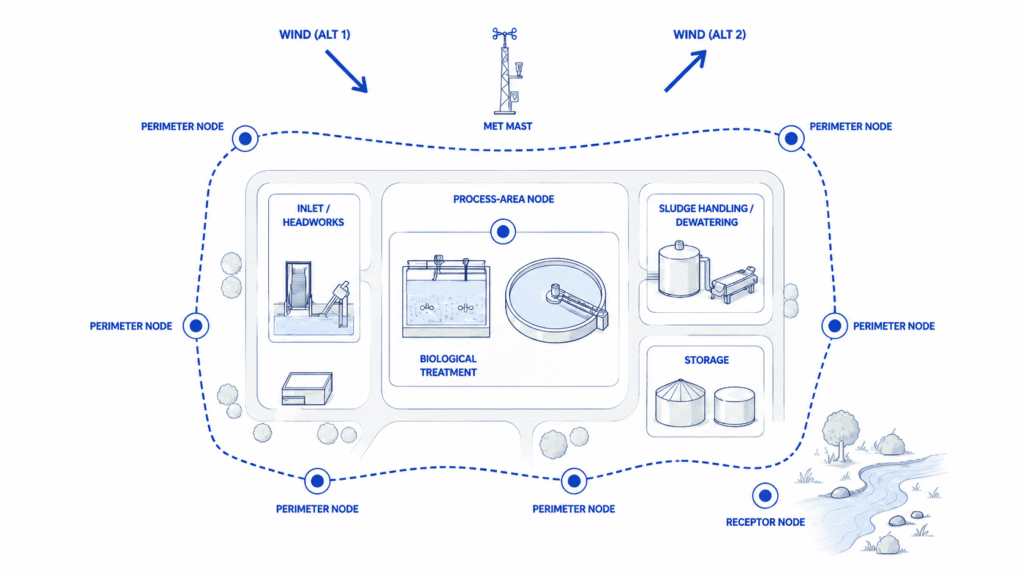
A wastewater treatment plant is not one uniform environmental source, and a fence is not one uniform monitoring location. Start with plausible process areas, pathways to the boundary and the receptors or off-site questions that matter. Then assign each node a clear observation role.
Process-area nodes
Use near-process ambient locations to observe changes close to environmentally relevant treatment, sludge handling, storage or other defined activities. These points can help compare timing with plant records, but they should still represent ambient air. A monitor inside a concentrated process stream or confined space answers a different question.
Perimeter nodes
Use boundary locations to compare what reaches different parts of the site perimeter as wind sectors change. Prevailing wind is useful for planning, but short-term and seasonal changes can reverse upwind and downwind roles. Multiple perimeter points may be justified where site geometry, source areas or wind sectors differ materially; there is no universal node count.
Receptor-oriented nodes
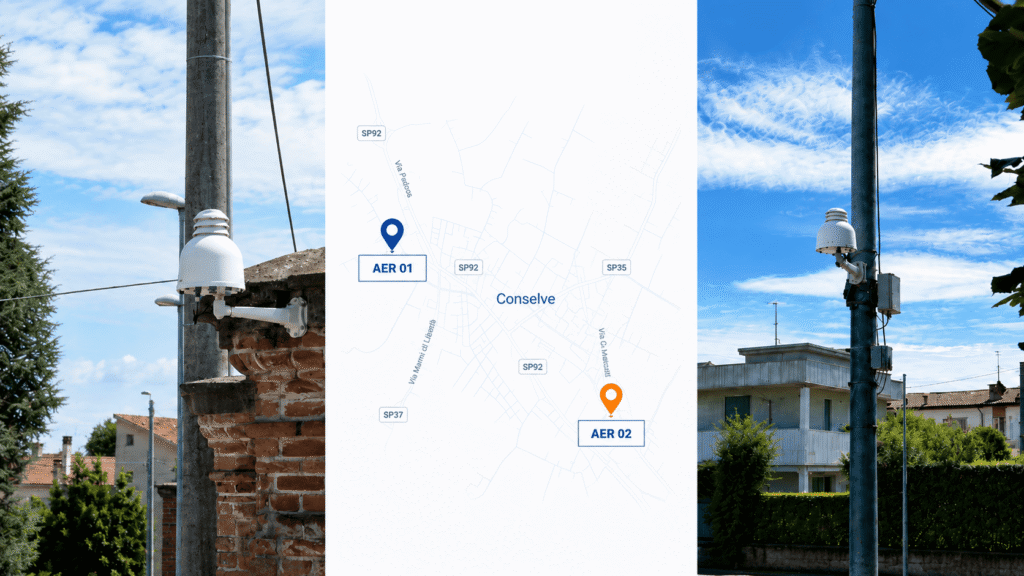
Use receptor-oriented monitoring only where a recurring off-site question justifies the additional location and deployment is feasible and appropriate. It can add spatial context to complaint or event review by comparing timing at process, boundary and receptor-oriented points. A concentration gradient may support a hypothesis, but it does not automatically identify the source.
Meteorology belongs in the network architecture, not only in the final analysis. Wind speed and direction help determine which comparisons are meaningful at a given time, while temperature and relative humidity can also matter for sensor interpretation. Buildings, tanks, terrain and calm conditions can create local flows that make simplistic upwind/downwind labels unreliable.
Turn continuous measurements into an environmental action workflow
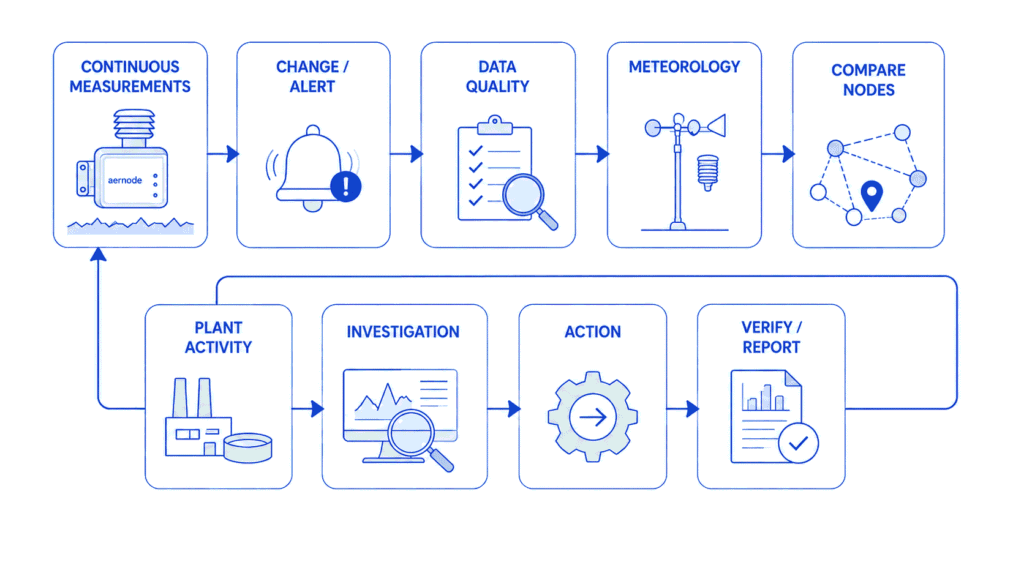
A useful network does not stop at collection. It should define what happens when a change is detected, a complaint is received or a recurring pattern deserves review. The same sequence can be reused for odour-related events, unusual gas or particulate conditions, mitigation follow-up and other environmental questions:
- Measure. Maintain continuous, time-synchronised measurements and device-status records across the defined network roles.
- Detect or flag change. Identify an unusual reading, configurable alert, complaint time or recurring pattern that deserves review.
- Check data quality. Confirm device status, data completeness, maintenance/calibration history and relevant environmental effects before interpreting the signal.
- Add meteorological context. Review wind speed and direction and, where relevant, temperature and relative humidity for the same period.
- Compare locations. Determine whether the pattern is local, shared across nodes or spatially compatible with a plausible pathway.
- Review plant activity. Check time-matched operational records such as sludge handling, maintenance, process changes, storage activity or odour-control status where relevant.
- Investigate. Combine the evidence, note credible alternatives and decide whether inspection, sampling, specialist assessment or another line of evidence is justified.
- Act where justified. Apply an operational or environmental response only when the evidence and site procedures support it.
- Verify and document. Review subsequent conditions, record the action and outcome, and retain the evidence for future comparison and reporting.
The operational logic mirrors the broader principle in Environment Agency odour-management guidance: monitoring results need a defined interpretation and documented follow-up. The guidance is specific to permitted activities in England; the reusable lesson is to design the investigation workflow before the event occurs.
Supports investigation – not automatic source attribution.
Use alerts as operating prompts, not verdicts
Continuous networks can generate project-specific alerts from selected parameters, data conditions or patterns. Their value is to shorten the time between a change and a review: an alert can prompt an operator to inspect plant conditions, compare other nodes, check meteorology or mark a period for later investigation.
Alert logic should be defined from the project objective and expected data behaviour. A gas threshold used as an operational prompt is not automatically an odour threshold, a health threshold or a regulatory exceedance. Automated rules can help surface events, but they should not replace data-quality review or professional interpretation.
Use before, during and after data to review mitigation and operational changes
A persistent environmental record makes it possible to compare conditions around operational or mitigation changes: before an intervention, while it is being implemented, and after the plant returns to a representative operating state. Examples may include maintenance, changes in sludge handling or storage practice, odour-control-system interventions or other site-specific measures.
The strongest review compares like with like as far as practicable: similar process conditions, meteorological context, network configuration and QA status. If measured conditions change after an intervention, the data can support operational review and verification. Simple before/after association alone does not prove causal effectiveness, especially when weather or activity changed at the same time.
Treat the data layer as part of the monitoring system
Field sensing is only the first layer of a continuous programme. For measurements to remain useful when an event is investigated days or months later, the supporting record must stay aligned with the time series.
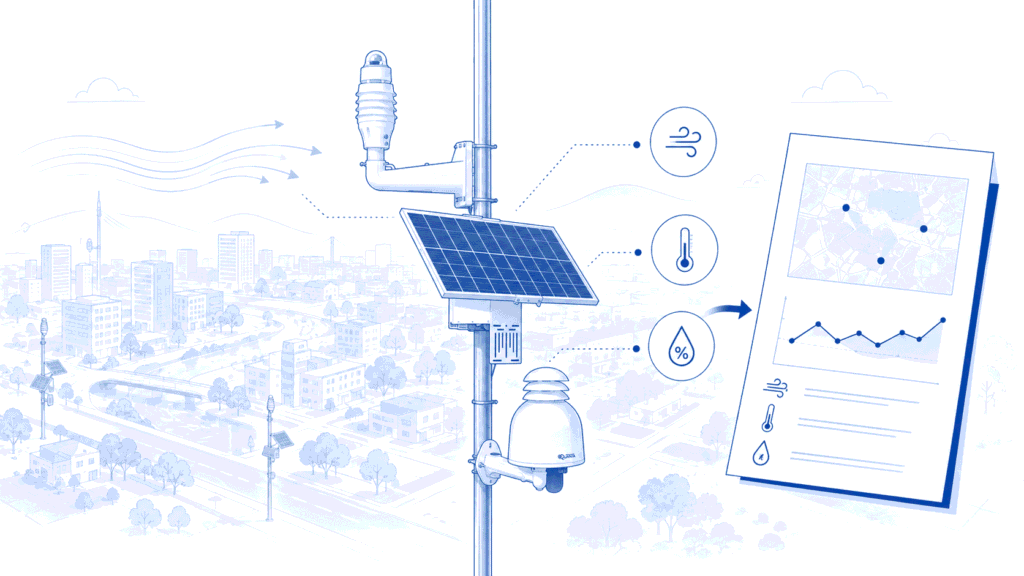
Field measurement + network supervision + data continuity + historical record + event / alert management + analysis + reporting form one environmental information chain.
Timestamps, time zone, device status, data completeness, maintenance history, calibration or adjustment records, meteorology and relevant plant activity should be retained in a way that allows the event window to be reconstructed. Otherwise, a concentration trace can lose the context needed to decide whether it represents an environmental change, a device issue or an incomplete record.
Historical data also enables recurring-pattern analysis: comparing operating periods, seasons, wind sectors and repeat activities can reveal conditions that consistently deserve closer investigation. The same record supports internal environmental reviews, complaint follow-up, periodic reporting and, where appropriate, evidence-based discussion with municipalities, authorities or neighbouring communities.
QA keeps multi-node comparisons interpretable
The Enhanced Air Sensor Guidebook from the U.S. EPA recommends matching sensors to the monitoring objective, expected concentration range and environmental conditions. Its guidance is not European regulation, but the technical principles are transferable to distributed environmental networks.
Reliable comparison depends on appropriate sensing configuration, calibration or verification, maintenance, awareness of interferences and environmental response, and consistent treatment across the fleet. U.S. EPA air-sensor QA guidance also highlights frequent data review, data completeness, maintenance, QC checks and periodic collocation as practical ways to keep sensor data useful for their intended purpose.
This becomes especially important when the environmental signal is small relative to baseline drift, cross-sensitivity or changing temperature and humidity. QA is therefore not a separate laboratory exercise; it protects the comparisons on which the operational workflow depends.
Know what continuous environmental monitoring does not replace
A distributed chemical and particulate monitoring network is an additional environmental evidence layer. It does not automatically replace direct odour assessment or dynamic olfactometry, formal odour surveys, permit-specific emissions measurements, statutory/reference methods, occupational or confined-space monitoring, process instrumentation, or source-attribution studies that require stronger evidence.
Applicable national, local, permit, planning and project requirements should be checked separately. Where a formal method is specified, the continuous network can provide operational context around that method but should not be presented as an equivalent substitute without specific evidence and approval.
How Aernode supports this monitoring architecture
The Aernode ecosystem can support wastewater treatment monitoring as a distributed environmental programme rather than a single-gas installation. The Aernode Air Quality Monitor provides continuous outdoor multi-pollutant field measurements and can integrate compatible wind sensing. Sensor Kits allow the gas-sensing configuration to be selected around the target pollutants, expected range, environmental conditions and project requirements.
Aernode Cloud provides the network-supervision and historical-data layer for devices and measurements, while Reporting Tools can add real-time and historical views, cross-parameter analysis, configurable alerts, scheduled reporting and selected communication outputs. The value of the stack comes from keeping field measurements, device context and historical evidence connected to the monitoring workflow.
Configuration remains project-specific. Aernode can support supplementary environmental monitoring and, where the applicable pollutant, measurement method and quality framework support it, indicative monitoring. It is not positioned here as direct odour measurement, occupational safety instrumentation, automatic source attribution or a replacement for formal methods required by an applicable framework.
Build a continuous environmental evidence layer around the plant
The value of continuous wastewater air-quality monitoring does not come from measuring one gas or installing the largest possible number of sensors. It comes from creating a persistent, interpretable record across the areas, parameters and operating conditions that matter.
Define the environmental decisions first. Select only the measurements that help answer them. Give each node a clear observation role. Keep meteorology, plant activity, device status and historical records aligned with the measurements. Then use a repeatable workflow to detect changes, investigate them, act where justified, verify the outcome and document what was learned. That is how a distributed network becomes an environmental management tool rather than simply a collection of instruments.
The additional value is not only analytical. A structured continuous programme creates a documented record of how environmental conditions are observed, how unusual events are investigated and how actions are followed up. That record can support more transparent and evidence-based dialogue with regulators, municipalities and neighbouring communities. It does not replace formal methods or demonstrate compliance by itself; its role is to move environmental management from intermittent or purely reactive observation toward a persistent, structured and reviewable evidence system.
Technical References
1. Environment Agency. Odour management: comply with your environmental permit – 6. Writing an odour management plan. Regulator guidance for England, 3 December 2025; used for source-pathway-receptor reasoning, auditable monitoring records, predefined interpretation of monitoring results, documented decision-making, complaint investigation, remedial-measure records, proactive problem recognition and instrument maintenance.
2. Environment Agency. Odour management: comply with your environmental permit – 5. Assessing the impact of odour. Regulator guidance for England, 3 December 2025; used for limitations of instrumental/surrogate monitoring and the distinction between chemical measurements and odour assessment.
3. U.S. Environmental Protection Agency. Enhanced Air Sensor Guidebook. 2022. U.S. technical guidance; used for transferable objective-led planning, sensor selection, siting, meteorology and performance principles rather than as European regulation.
4. U.S. Environmental Protection Agency. Quality Assurance for Air Sensors. Current technical guidance; used for transferable QA/QC, data completeness, maintenance, data review and collocation principles.
5. Joo HS, Han SW, Lee CS, Jang HS, Kim ST, Han JS. Field application of cost-effective sensors for the monitoring of NH3, H2S, and TVOC in environmental treatment facilities and the estimation of odor intensity. Journal of the Air & Waste Management Association. 2023;73(1):50-64.
6. Luckert A, Aguado D, García-Bartual R, et al. Odour mapping and air quality analysis of a wastewater treatment plant at a seaside tourist area. Environmental Monitoring and Assessment. 2023;195:1013.
7. Zwain HM, Nile BK, Faris AM, et al. Modelling of hydrogen sulfide fate and emissions in extended aeration sewage treatment plant using TOXCHEM simulations. Scientific Reports. 2020;10:22209.