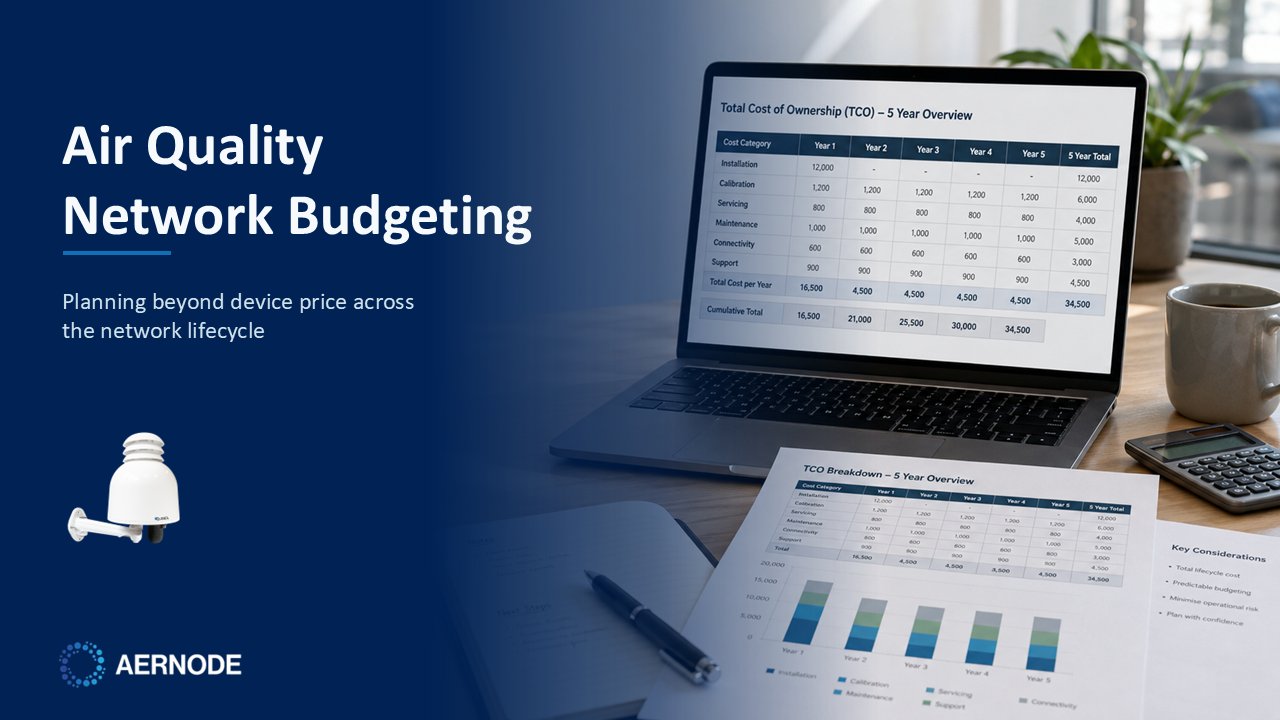
An air-quality monitoring network is not simply the unit price of a monitor multiplied by the number of locations. Over a multi-month or multi-year project, the network also creates costs around installation, site access, power, communications, calibration and quality assurance, servicing, sensor replacement, data management, staff time and downtime. A low purchase price can therefore be a poor proxy for the cost of keeping useful measurements available over the life of the project.
The practical comparison is total cost of ownership (TCO) across a defined monitoring objective, network size and operating period. This Guide focuses on stationary outdoor air-quality monitoring networks, with particular relevance to distributed continuous sensor-based systems. It does not provide vendor price benchmarks: prices change quickly, and a number is only meaningful when the measurement role, number of points, services and quality requirements are genuinely comparable.
Start with the monitoring question, not the price list
Before comparing equipment, define what the network needs to answer. The monitoring objective determines the pollutants, number and location of measurement points, time resolution, project duration, data workflow and quality controls that make the dataset fit for its intended use.
That matters economically because two proposals can have similar hardware prices while representing very different networks. One may include the number of points required to compare locations, suitable power and communications, periodic calibration or verification, a managed data layer and field servicing. Another may price only the device and leave the rest of the operating model to the buyer. Conversely, a more capable station can still be poor value if the project mainly needs broader spatial coverage at more locations.
Sensor-system purchase price does not include all of the operating work required to deploy, calibrate, maintain and manage a monitoring network. Installation, calibration, maintenance and data treatment therefore need to be evaluated separately from acquisition cost. For procurement, this is the distinction between buying an instrument and operating a monitoring network.
A practical TCO model for air-quality monitoring networks
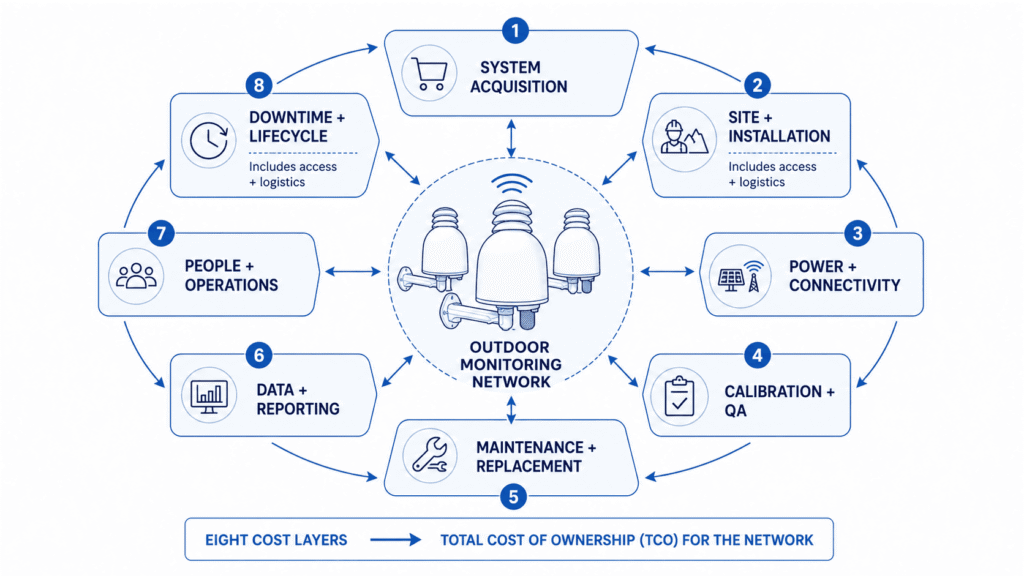
Network TCO = acquisition + deployment + power and communications + QA / calibration + servicing and replacement + data and reporting + operating labour + continuity and end-of-project costs.
The exact line items vary by method and project, but the following framework is broad enough to compare most stationary outdoor network options without pretending that every cost is known in advance.
| Cost area | What it can include | Question to ask |
|---|---|---|
| System acquisition | Monitoring stations, sensor configuration, accessories, spares, gateways or supporting equipment. | Are comparable pollutant capability, measurement role and required accessories included? |
| Site and installation | Mounting, poles or structures, civil/electrical work, site surveys, permissions, access equipment and commissioning. | Does the quote assume existing infrastructure, or will the site need work before the monitor can operate? |
| Power and communications | Grid connection, solar/battery systems, energy, cellular data, Wi-Fi infrastructure, local communications and integration hardware. | What must be installed and paid for at each location, and what changes at remote sites? |
| Calibration and QA | Factory or laboratory calibration, field collocation, checks, reference access, QA/QC procedures, data review and documentation. | What work is needed to keep the data suitable for the intended use over time? |
| Maintenance and replacement | Cleaning, consumables, sensor or module replacement, shipping, technician travel, workshop work, tools and planned service visits. | Which components have limited life, who can replace them, and does servicing require removal of the full station? |
| Data and reporting | Cloud or software fees, storage, API access, dashboards, data processing, exports, alerting and report production. | Which functions are included, and which must be implemented or operated elsewhere? |
| People and operations | Network supervision, QA review, alert triage, field coordination, reporting, training, stakeholder communication and administration. | How much staff time remains after automation is accounted for? |
| Continuity and lifecycle | Downtime, failed communications, spare units, redundancy, emergency visits, relocation, replacement, retrieval and decommissioning. | What is the cost of losing data or mobilising people when a point is unavailable? |
Site access, available power and communications should be assessed before a monitoring location is finalised. Supplying power, connectivity or access infrastructure after the site has been selected can add significant installation effort and cost. The underlying planning principle is transferable even where the supporting guidance is non-regulatory and U.S.-specific.
Network size, project duration and site logistics drive lifecycle cost
Lifecycle cost is shaped by three connected variables: how many monitoring points are operated, how long they remain in service, and how difficult those locations are to access and support. A small increase in recurring cost per point can become material across a large network, while a one-off site-preparation cost can dominate a short campaign. The same node count and duration can also produce very different operating burdens when site logistics differ.
Geographic distribution matters as well. Ten monitoring points within one accessible facility create a different servicing model from ten points distributed across several facilities, municipalities or remote sites. Travel distance, access procedures, technician mobilisation, spare-parts logistics and restricted service windows should therefore be considered alongside point count and operating duration.
This is why network design and TCO should be developed together. Too few locations may fail to capture the spatial comparison the project needs. Too many points can add installation, connectivity, QA and servicing work without improving the decision. The economic objective is not the maximum number of devices or the minimum number of devices; it is enough well-placed, supportable measurement points to answer the monitoring question.
For internal comparison, one useful denominator is planned monitoring point-years – for example, ten points operated for two years equals twenty point-years. Dividing TCO by point-years can expose a proposal that appears cheaper only because it provides fewer locations or a shorter operating period. It is not a performance metric. Siting, data quality and measurement capability still determine whether each point is useful. A lower cost per point-year is meaningful only when the compared points provide sufficiently comparable measurement capability and decision value.
The costs that are easiest to underestimate
Calibration, QA and data quality
Sensor-based networks require a defined quality workflow, not only a deployment plan. Depending on the measurement objective, this can include field collocation, calibration or adjustment, drift checks, data screening, documentation, reference comparisons and periodic review. These activities create labour and sometimes access to reference instrumentation or controlled calibration resources.
Calibration intervals, QA/QC and data management are recurring network-operation tasks, as are data review and documentation where required by the project QA plan. Their cost belongs in the operating model rather than being treated as an optional quality layer added after deployment.
Field access, servicing and downtime
A service event is rarely just the price of a replacement sensor. It can also involve travel, permits, site induction, access equipment, technician mobilisation, shipping, temporary removal of the station, re-commissioning and post-service data checks. These costs become more important when sites are remote, access windows are restricted or a fleet is distributed across several facilities or jurisdictions.
Service architecture therefore matters. A design that allows a limited-life sensing assembly to be changed in the field produces a different operating model from one that requires the complete station to be returned to a workshop. Neither model is automatically cheaper in every project; the relevant question is how often service is expected and what each intervention requires.
Data and operational workload
Continuous measurements create an ongoing data workload. Someone or some system must receive the data, store it, apply the required processing, monitor device status, review anomalies, manage users, configure alerts and produce outputs for the people who need them. A platform subscription may consolidate several of these functions, while a local or third-party architecture may shift more responsibility to the customer, integrator or monitoring-service provider.
Automation changes the distribution of work, but it does not make operational responsibility disappear. A realistic TCO model should identify who owns each recurring task and whether that work is included in a supplier service, absorbed by internal staff or purchased from another provider. When a recurring task is not included in the supplier scope, it should be assigned explicitly to the organisation that will perform it and valued within the same comparison. Where a monetary estimate is genuinely unavailable, the responsibility and workload should still be recorded rather than omitted.
Purchase, rental and managed service models: compare scope, not labels
The commercial model changes cash flow and responsibility allocation, but it does not remove the underlying cost categories. A purchased network typically has a larger upfront hardware component and separate recurring costs. Rental, subscription or managed-service models may bundle hardware, connectivity, software, servicing or support into recurring fees.
For a fair comparison, unpack each offer into the same TCO structure. Check what happens to calibration, replacement parts, site visits, communications, cloud access, data export, reporting, technical support and end-of-term equipment. A lower annual fee is not automatically lower TCO if important work sits outside the contract; a higher recurring fee is not automatically more expensive if it replaces substantial internal or field-service effort.
How to compare two network options without false precision
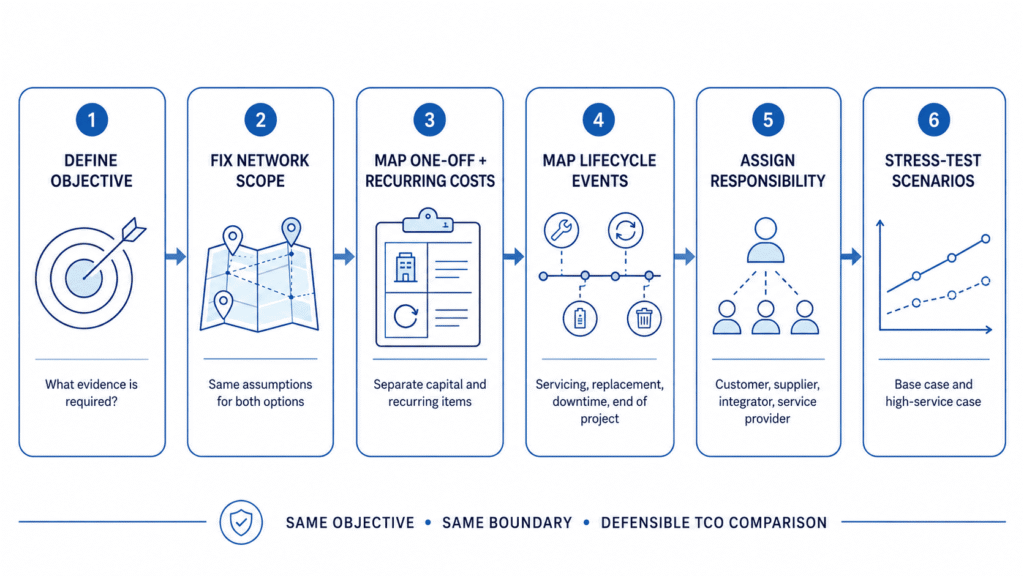
- Fix the monitoring objective. Define the decision the data must support, the pollutants, evidence role and the minimum useful temporal and spatial coverage.
- Fix the comparison boundary. Use the same number of points, operating period, sites, data frequency, reporting scope and expected service conditions for both options.
- Separate one-off and recurring costs. Acquisition and installation should not be mixed with annual communications, software, calibration, servicing and staff time.
- Map lifecycle events. Identify expected cleaning, verification, sensor or consumable replacement, battery work, firmware / configuration support, relocation and end-of-project retrieval.
- Assign responsibility. Record whether each task is performed by the supplier, integrator, service provider, customer staff, IT team, field contractor or environmental consultant, and whether its cost is included.
- Stress-test uncertainty. Build at least a base case and a higher-service case for variables such as additional site visits, earlier sensor replacement, communications changes, project extension or more demanding site access.
Where the numbers are uncertain, a range is more defensible than a single highly precise total. The purpose of the model is to expose assumptions and compare like with like, not to predict every future maintenance event.
What changes by project type
Temporary construction and demolition monitoring. Project duration, rapid installation, relocation between work phases, off-grid power, site access and routine reporting can matter more than long asset life. Where a project needs flexible temporary deployment, the same TCO framework should test the cost of moving or servicing points as works progress. The Aernode page on construction and demolition monitoring illustrates the kinds of deployment, sensor and data-service choices that can sit inside this calculation.
Long-term industrial networks. A multi-year perimeter or operational network places more weight on uptime, replacement strategy, remote diagnostics, spare parts, repeat calibration / verification and the ability to service several points consistently. Travel and downtime can become as important as the component being replaced.
Research networks. Researchers may prioritise more locations, longer campaigns, access to raw or adjusted datasets, repeat collocation, metadata and integration with analytical workflows. In this case, TCO needs to include the labour required to preserve data comparability and document the measurement method, not only the number of sensor nodes purchased.
How Aernode affects the TCO equation
Aernode does not change the TCO framework; its architecture changes some of the assumptions inside it. The Aernode Air Quality Monitor combines a configurable outdoor station with multiple sensing layers. Aernode Sensor Kits allow sensing assemblies to be maintained or replaced independently, without requiring replacement of the complete monitoring station for sensing-layer servicing. The economic effect depends on sensor choice, project duration, field conditions and the servicing model; no universal saving should be assumed.
Deployment infrastructure can also be configured around the site. Aernode Accessories include mounting, power and meteorological options, including solar power for sites where grid supply is unavailable. These choices move cost between equipment, site preparation and ongoing maintenance, so they should be evaluated as part of the installation design rather than added after the hardware decision.
For network operation, Aernode Cloud centralizes device supervision, data storage, post-processing and controlled data access. Remote diagnostics and configuration can reduce the number of issues that require an immediate site visit, while field-replaceable components can shorten some service interventions. The value of those features is project-specific: it grows when travel, access or downtime are expensive, and may be less important for a short, easily accessible campaign.
Where a project requires recurring dashboards, alerts, scheduled reports or stakeholder-facing outputs, Aernode Reporting Tools can support part of that recurring workflow within a configured reporting environment. The relevant subscription, configuration and service scope should still be included explicitly in the TCO comparison rather than treated as cost-free automation.
The decision rule
The most useful TCO question is not “Which monitor is cheapest?” It is “What will it cost to keep the required evidence available, interpretable and operational for the full project?”
- Compare the same monitoring objective, number of locations and duration.
- Include installation, power and communications at each site.
- Budget for calibration, QA/QC, maintenance and replacement rather than assuming zero service.
- Make data-management, reporting and staff responsibilities explicit.
- Put a value on downtime, site visits and logistics where they are material.
- Test uncertainty with more than one lifecycle scenario instead of relying on a single optimistic total.
A network with a higher initial price can be the better economic choice if it reduces recurring work or supports the required measurement objective with fewer complications. A lower-cost system can be the better choice when its performance, service model and data workflow are sufficient for the project. Total cost of ownership does not select the answer by itself; it makes the trade-offs visible enough to make a defensible decision.
Technical References
3. U.S. Environmental Protection Agency. A Guide to Siting and Installing Air Sensors. 2026.
4. U.S. Environmental Protection Agency. Quality Assurance for Air Sensors. 2026.