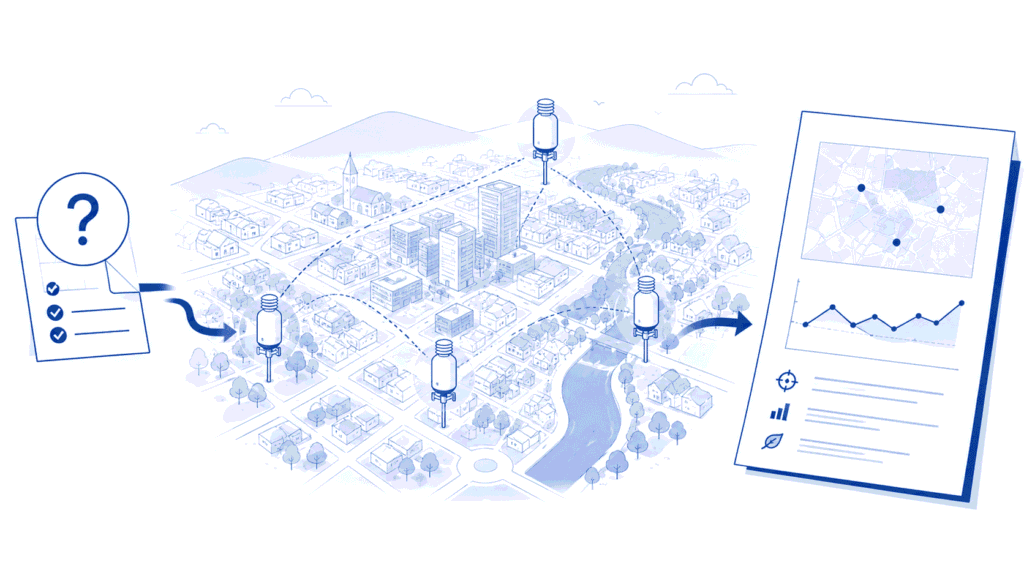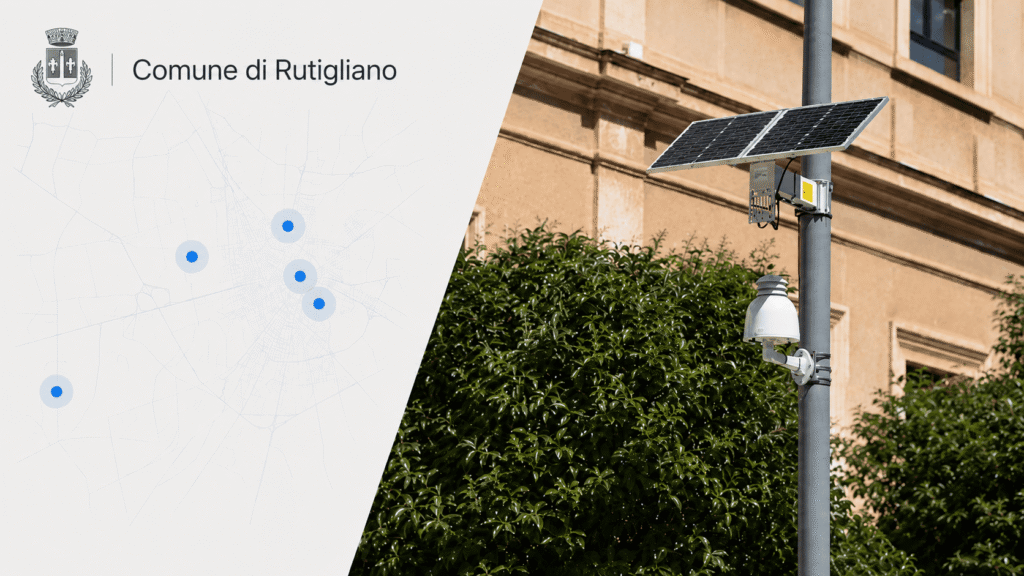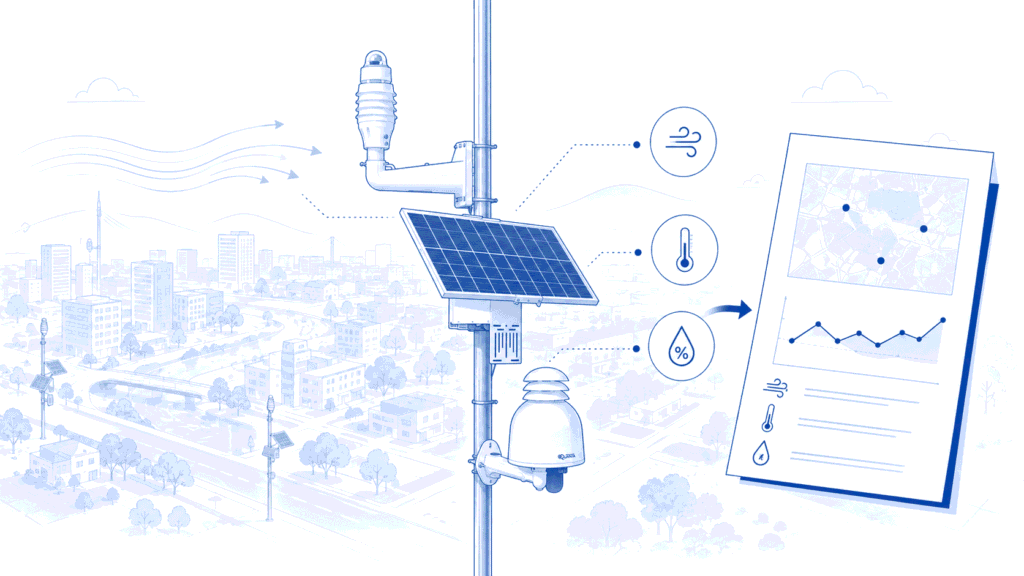
Castiglione delle Stiviere did not begin its air-quality program by installing a local sensor network. The first step was a SmartMuni Open Data service, which brought existing institutional and model-based information together in a single public environment. Around a year later, the program was expanded with three Aernode monitoring points, adding continuous observations from selected locations within the municipality.
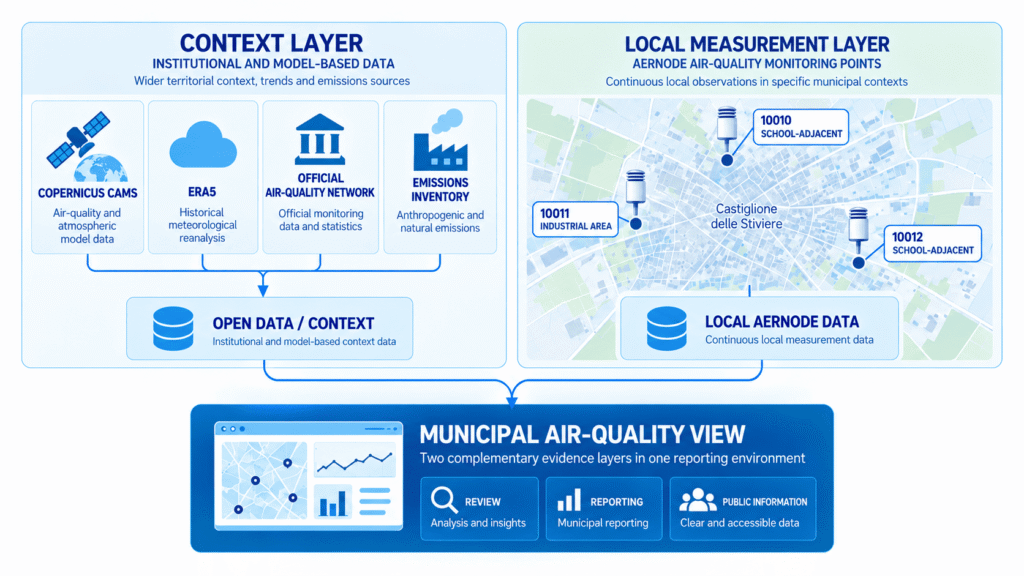
This created two complementary views of local air quality. Copernicus and regional institutional data provide the broader territorial and historical context, while the Aernode stations show how conditions evolve at specific monitoring points. Bringing these sources into the same information environment allows municipal teams and citizens to move from the wider picture to local observations while keeping the different origin, scale and role of each dataset clear.
The project therefore evolved in stages rather than being designed around a complete monitoring network from the outset. The open-data service established the initial information layer; local measurements were added when the program expanded to include site-specific observations. Both could then continue to be used together as part of the same municipal air-quality service. This is also a useful principle for distributed urban air-quality monitoring, where monitoring points are most valuable when each one responds to a defined local question.
The first layer: establish an air-quality information service from existing data
The first phase began with the launch of a public digital air-quality service. Delivered through SmartMuni, Quanta’s municipality-oriented information service, the portal made air-quality and climate information available through one interface without requiring the municipality to install field instruments at the outset.
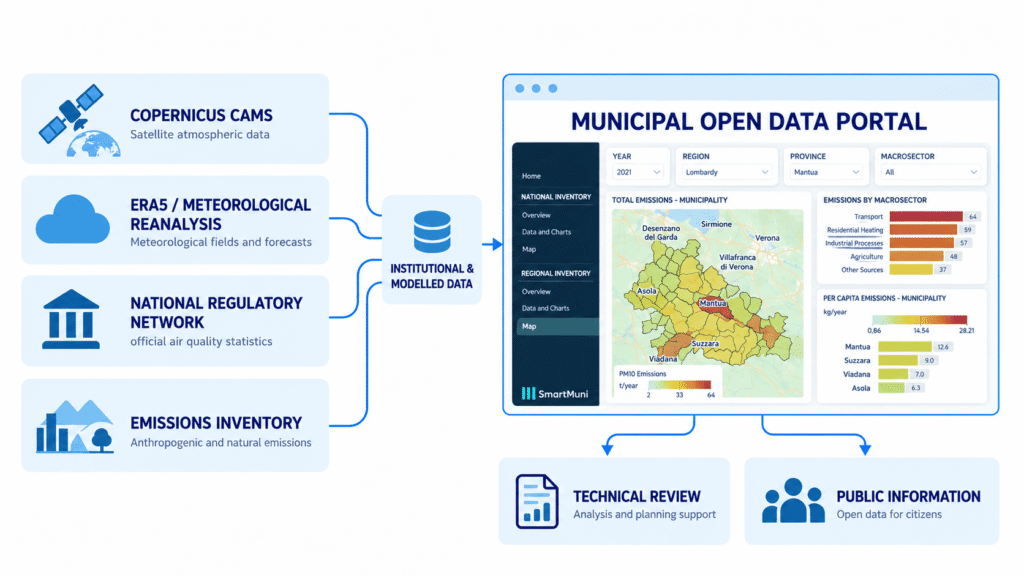
This layer is built around data that already exist from institutional and European services. The current project environment includes Copernicus air-quality information, ARPA statistics and an emissions-inventory view, while SmartMuni reports also use meteorological context from ERA5. The objective is not to create a new local measurement at every point in the city. It is to make broader environmental information easier to consult, compare and communicate.
The distinction in scale matters. The CAMS European air-quality analyses and forecasts are provided on a 0.1-degree grid, approximately 10 km, and combine model output with observations from the European Environment Agency. ERA5 is a global meteorological reanalysis supplied on a gridded basis. These products are valuable for territorial context and time-series analysis, but they are not equivalent to a point measurement taken next to a school or within an industrial area.
The open-data layer also became a continuing service rather than a one-off publication. The municipality continued to publish periodic air-quality reporting using CAMS and ERA5 information, maintaining an organized environmental information workflow before and alongside the addition of local field measurements.
Why the open-data layer and local measurements answer different questions
A municipal air-quality data platform is strongest when each source is used for the question it can actually answer. Institutional observations, modelled air-quality fields, reanalysis data and emissions inventories describe different parts of the environmental picture. A local monitoring station adds another type of evidence: a continuous record from one specific installation point.
The difference is therefore not simply ‘coarse data versus better data’. The two layers have different provenance, spatial meaning and uncertainty. A broader modelled field can help place local conditions in a regional context; a ground station can show how concentrations changed at a selected site and how that pattern compares with another local point. Neither should be used as a substitute for the other.
This separation also improves communication. When a public portal keeps the source and role of each dataset clear, users can understand whether they are looking at a regional model, an official monitoring statistic or a local supplementary measurement. The combined service becomes more useful precisely because those distinctions are preserved.
The second layer: three local Aernode monitoring points
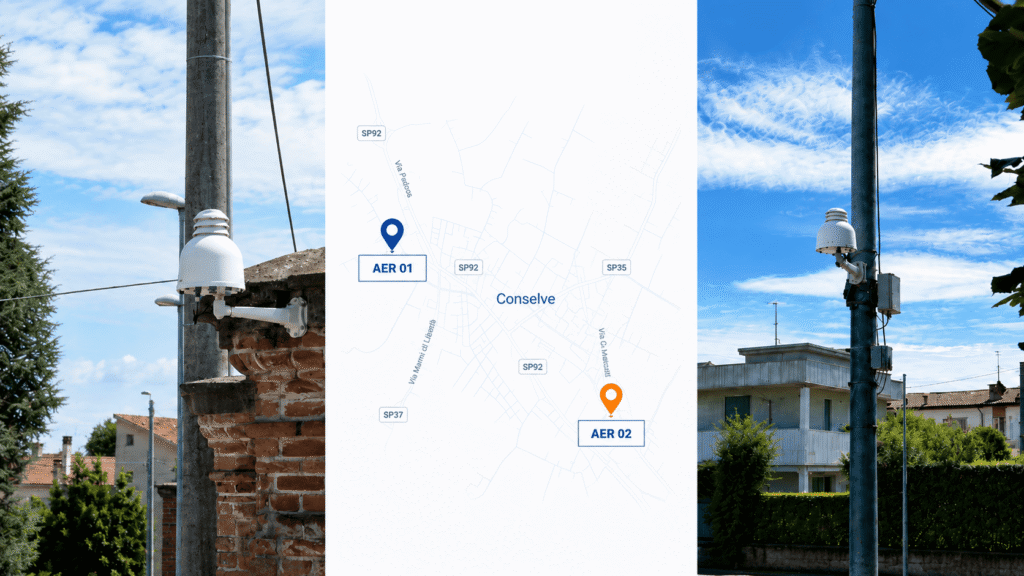
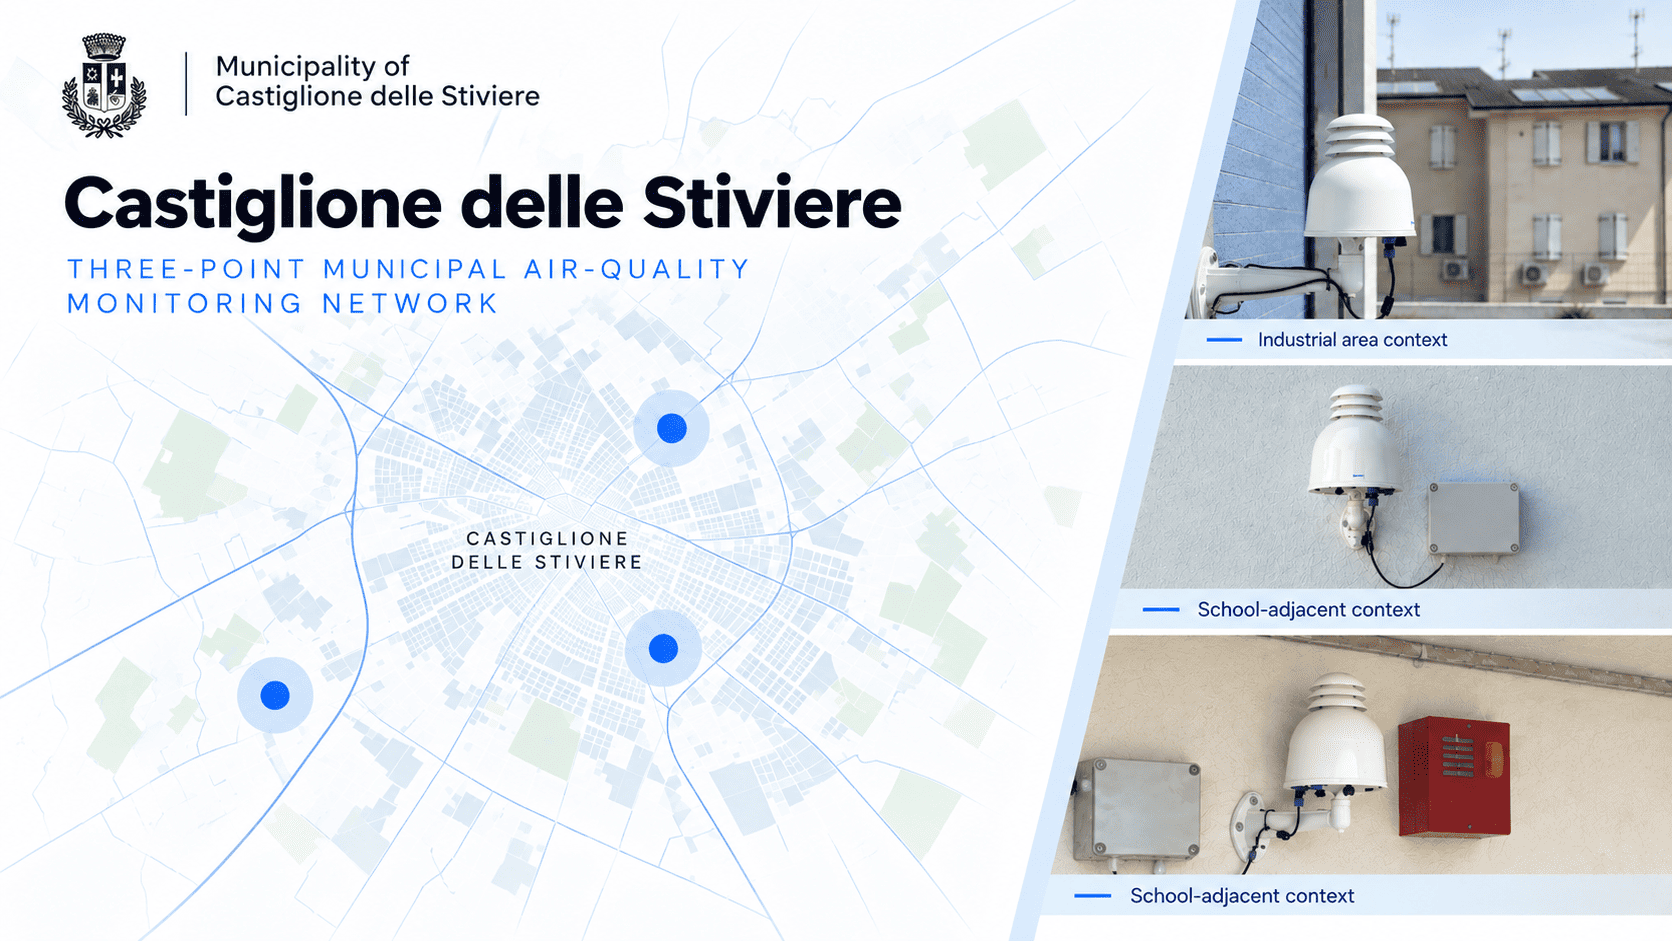
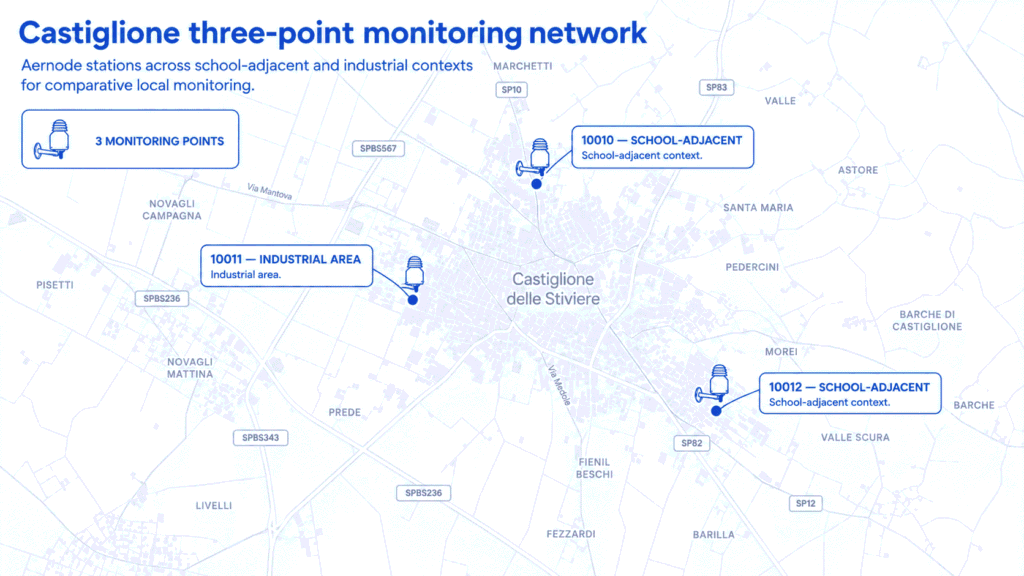
After approximately twelve months of operating the portal, the municipality added a local network of three Aernode stations. Two points were installed near educational sites and one in an industrial area, giving the program continuous observations from contrasting municipal contexts.
All three points monitor PM10, PM2.5, nitrogen dioxide (NO2) and ozone (O3), together with temperature and relative humidity. Using a consistent parameter set across the three locations supports like-for-like comparison over aligned periods, while the environmental variables provide context for changing atmospheric conditions.
| Station | Site context | Role in the municipal layer |
|---|---|---|
| 10010 | Near an educational site | Local observation in a school-adjacent municipal setting; no pollution problem is assumed by the siting. |
| 10011 | Industrial area | Adds a productive / industrial context for comparison with the other municipal locations. |
| 10012 | Near an educational site | Provides a second school-adjacent point for spatial and temporal comparison. |
The site roles are deliberately different. The two school-adjacent locations provide observations in sensitive municipal settings without assuming that a pollution problem is present. The industrial-area point adds a productive context that can be compared with the other locations. The network is therefore useful as a local spatial layer, not as three isolated devices.
In Castiglione, the important project lesson is not the hardware specification alone; it is that the measurement layer was added only when the municipality wanted observations at a finer local scale than the initial information service could provide.
One municipal view, two evidence layers
The strongest part of the Castiglione architecture is that the local network did not make the original portal redundant. The current SmartMuni environment exposes separate views for Copernicus, the municipal network, ARPA statistics and the emissions inventory. A user can therefore move between territorial context and locally measured time series within the same municipal information service while retaining the identity of each source.
Within the Aernode ecosystem, this is the broader role of the data and reporting stack. Aernode Cloud provides centralized storage, network supervision and controlled access for Aernode measurements, while Aernode Reporting Tools can combine compatible external datasets – including Copernicus data – with Aernode measurements in project-specific dashboards and public-facing views. At municipal level, external context and local measurements can therefore coexist within one reporting environment while retaining the identity and provenance of each data source.
| Dimension | Open-data context layer | Local Aernode layer |
|---|---|---|
| Primary source | Institutional / model-based datasets such as Copernicus, ARPA statistics and emissions inventories | Three Aernode monitoring points installed on the municipal territory |
| Spatial role | Broader territorial, historical and contextual view | Continuous local observations at selected sites |
| Municipal field hardware | Not required for the information service itself | Required at each selected monitoring point |
| Main value | Context, historical review and public communication | Local comparison, temporal patterns and site-specific observation |
| Interpretation boundary | Does not create a point measurement at every location | Does not replace competent-authority assessment or prove a source by itself |
For a municipal user, the practical benefit is not that every dataset is forced into one number. It is that different data layers can be reviewed together. A regional pattern can be compared with the local network; a local variation can be checked against wider meteorological or air-quality context; and the public communication layer can remain consistent as new measurement capacity is added.
What the combined architecture enables
The combined service supports several practical workflows. Municipal staff can review broad territorial conditions and then inspect whether similar or different patterns are present at the three local stations. Historical views can be used to compare locations and periods. Public information can be maintained in one environment instead of sending users to unrelated sources with different interfaces and terminology.
The architecture is also incremental. Adding a local network does not require discarding the existing open-data service, and starting with the open-data service does not commit the municipality to a later sensor deployment. Each layer can stand on its own when that is the right scope; the value of the combined approach appears when the municipality needs both context and local observation.
There is also an important interpretation safeguard. A difference between a local station and a modelled or institutional dataset is not automatically an error, because the sources represent different spatial scales, methods and locations. Likewise, a difference between two local stations is evidence of different observed conditions, not proof of a specific emission source. European Commission JRC guidance on sensor-network deployment emphasizes study design, verification, quality control and appropriate use of sensor data; those principles remain relevant when local measurements are added to a broader information platform.
The local network complements official air-quality assessment
The Castiglione service is an additional municipal information layer. It does not replace the official air-quality assessment carried out by ARPA Lombardia or establish regulatory compliance on its own.
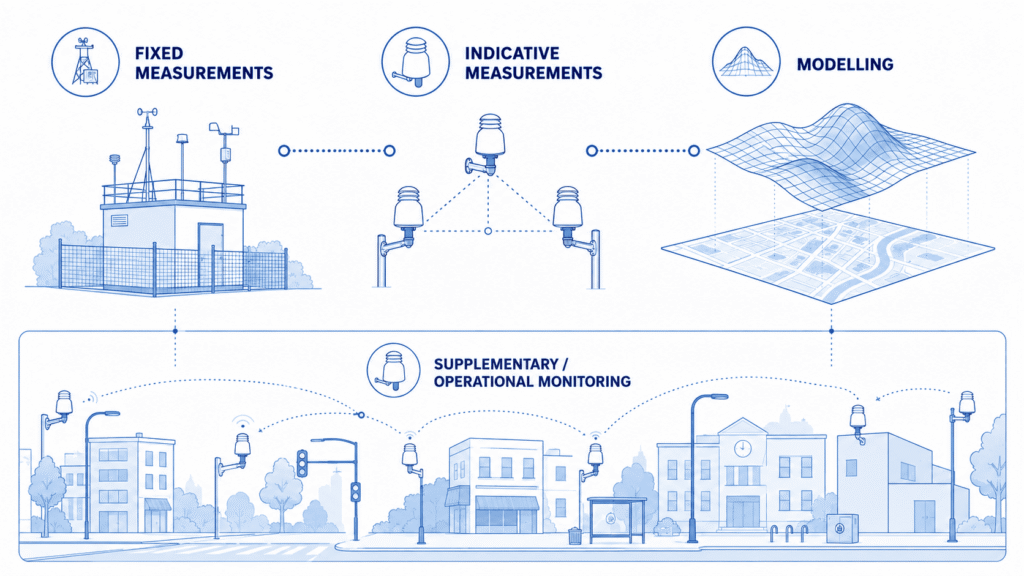
Directive (EU) 2024/2881 defines formal roles for fixed measurements, modelling applications and indicative measurements within ambient-air assessment, together with data-quality and coverage requirements. In this context, the three Aernode stations form a supplementary local monitoring layer alongside institutional and model-based information.
A phased architecture for municipal air-quality monitoring
The Castiglione project shows that a municipal air-quality program can begin with an information layer rather than with field hardware. Existing institutional and Copernicus data can first provide an organized environmental context; local monitoring can then be added when the program requires observations at specific points within the municipality.
The sequence does not need to be fixed. Depending on the monitoring objective, a municipality may begin with an open-data service, a local monitoring network or a combination of both. Each layer can remain useful on its own, while the combined architecture becomes particularly valuable when broader context and local observation are both required.
The architectural principle is straightforward: keep broader context and local measurement distinct, make both accessible through a coherent information workflow, and add measurement capacity where it answers a defined municipal question. Castiglione delle Stiviere provides a practical example of how those layers can form one continuing air-quality service.
Technical References
- Copernicus Atmosphere Monitoring Service – CAMS European air quality forecasts and analyses.
- Copernicus Climate Data Store – ERA5 hourly time-series data on single levels from 1940 to present.
- European Commission Joint Research Centre – Guidance on low-cost air quality sensor deployment for non-experts based on the AirSensEUR experience (JRC130628, 2022).
- Directive (EU) 2024/2881 on ambient air quality and cleaner air for Europe.