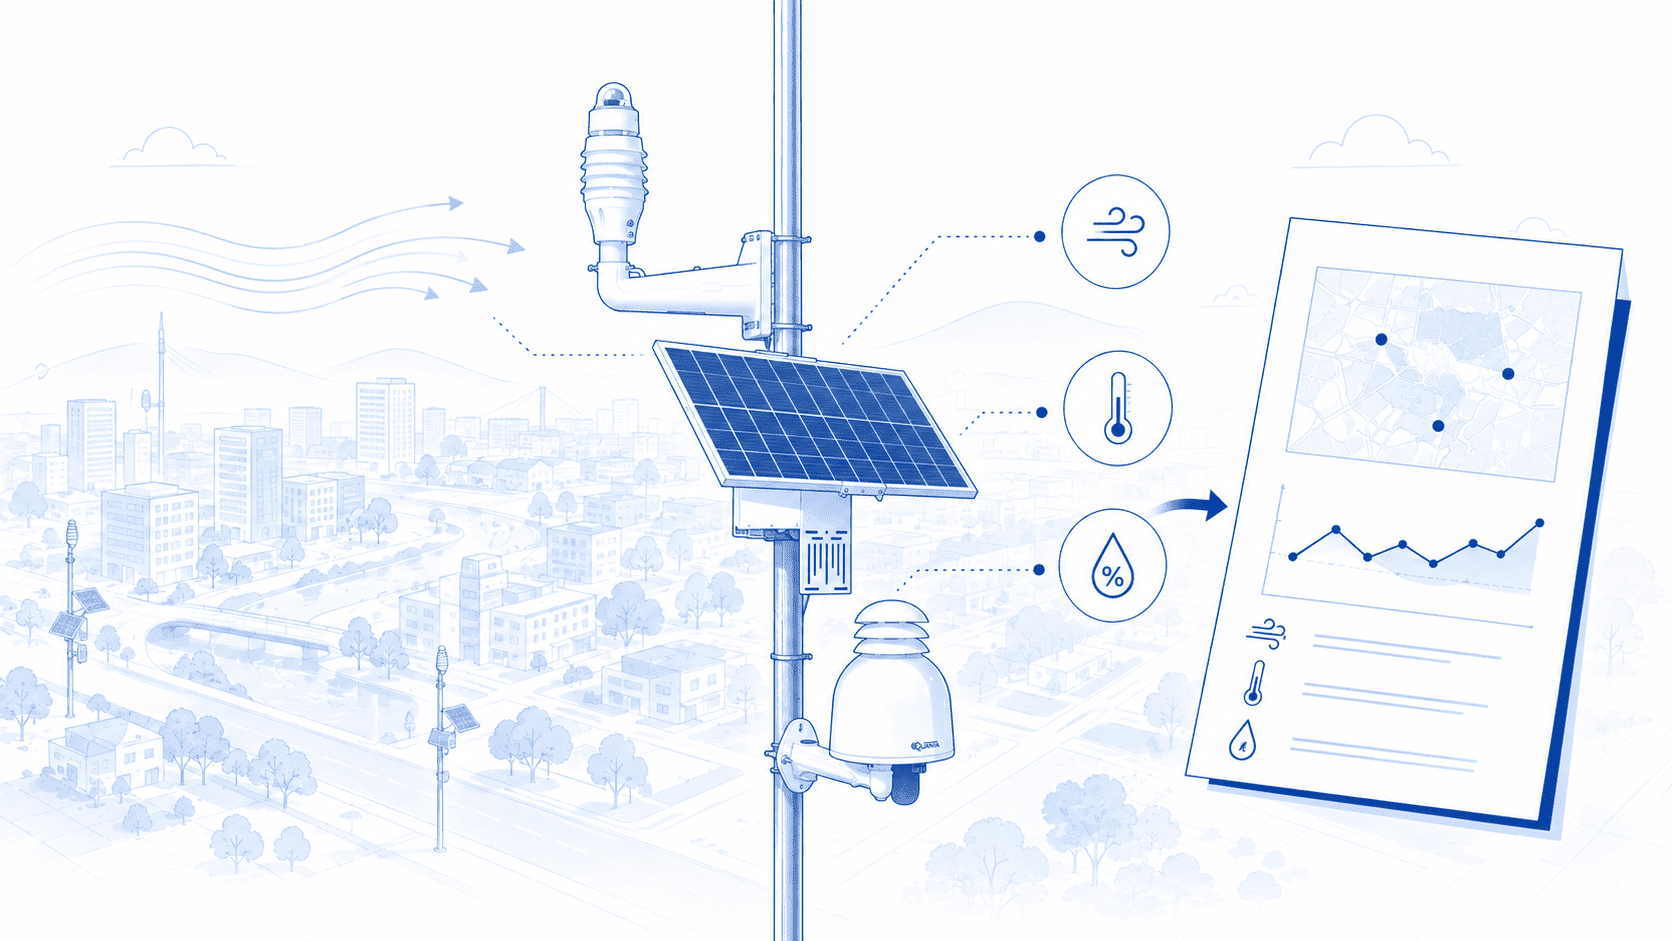
An air-quality measurement tells you the concentration recorded at a particular point and time. It does not, by itself, explain why that concentration changed. Meteorological data adds the context needed to interpret many short-term variations: wind describes transport and directional conditions, temperature helps interpret atmospheric mixing and stability, and relative humidity is particularly important when reviewing particulate measurements.
For continuous monitoring, this matters whenever a team has to investigate a peak, compare locations, review a site-boundary event or decide whether a pattern deserves follow-up. Similar emissions can produce different measured concentrations under different atmospheric conditions, and the same concentration pattern can support different working hypotheses depending on wind, mixing and humidity context.
Other meteorological variables, including precipitation, atmospheric pressure and solar radiation, can also be valuable in environmental monitoring. This Guide focuses specifically on wind, temperature and relative humidity because of their direct role in interpreting continuous air-quality measurements. Meteorological monitoring for independent operational purposes — such as local rainfall, wind or urban microclimate observation — is a separate monitoring objective.
Meteorology should therefore be treated as contextual evidence. It can strengthen an investigation, but it does not prove source attribution, replace data quality checks or change the formal evidence role of the underlying air-quality measurement.
Meteorological data changes what an air-quality reading means
Pollutant dispersion depends strongly on wind speed, wind direction and atmospheric stability, together with geography, source characteristics and the physical and chemical behaviour of the pollutant. Concentration at a monitoring point therefore reflects not only what may have been emitted, but also the conditions that transport, dilute, transform or accumulate pollutants before they reach the monitor.
For operational interpretation, three questions are especially useful: where is the air arriving from, are transport and mixing conditions favouring dilution or accumulation, and are temperature or relative humidity relevant to pollutant or aerosol behaviour? Together they move event review from “the concentration changed” to “under what conditions did it change?”
Wind: transport and dispersion context
Wind direction shows the sector from which air is arriving
Wind direction is normally reported as the direction from which the wind is blowing. When a concentration increase repeatedly occurs while winds arrive from a particular sector, the pattern can help define an upwind area that deserves investigation. In a distributed network, the same information can help distinguish which monitoring points are upwind, downwind or crosswind under a given set of conditions.
This is especially useful in construction-site monitoring, industrial boundaries, waste facilities and other sites where activities are spatially separated. The interpretation must remain directional rather than causal: a wind sector can be consistent with one or more potential source areas, but concentration and wind direction alone do not prove that a specific activity caused the event. Multiple sources, background transport, recirculation around buildings and transport time may all contribute.
Wind speed changes how local signals are diluted and transported
Low wind speeds can favour local accumulation of primary pollutants when atmospheric mixing is weak. Higher wind speeds often increase dilution near a source, but the relationship is not simply “more wind equals cleaner air”. Wind can also transport pollutants across a site, change plume position, resuspend coarse material or alter how air moves around buildings and terrain. The effect depends on the pollutant, source geometry and local environment.
A useful event review considers wind speed and direction together. A high concentration under light and variable winds has a different interpretation from a high concentration that repeatedly occurs under a well-defined wind sector and established airflow. Both patterns may be meaningful, but they point to different next questions.
Calm or variable winds limit directional interpretation
Directional interpretation becomes less reliable during calm or highly variable wind conditions, when the reported sector may be unstable or poorly representative of pollutant transport. Calm periods should therefore be identified explicitly rather than interpreted in the same way as established airflow from a persistent sector. No single wind-speed threshold defines “calm” for every sensor, site or monitoring objective.
Local wind can differ from regional weather observations
Regional weather data can describe the broader air mass, while a municipal weather monitoring network may provide a more local observation layer; even then, airflow at a monitoring point may be modified by buildings, street canyons, stockpiles, vegetation, embankments or terrain. If the monitoring question depends on local source-to-receptor direction, the wind measurement should represent the scale of that question. A distant weather station may be adequate for regional context but insufficient for a complex industrial perimeter or enclosed urban corridor.
Wind roses and pollution roses summarize directional patterns
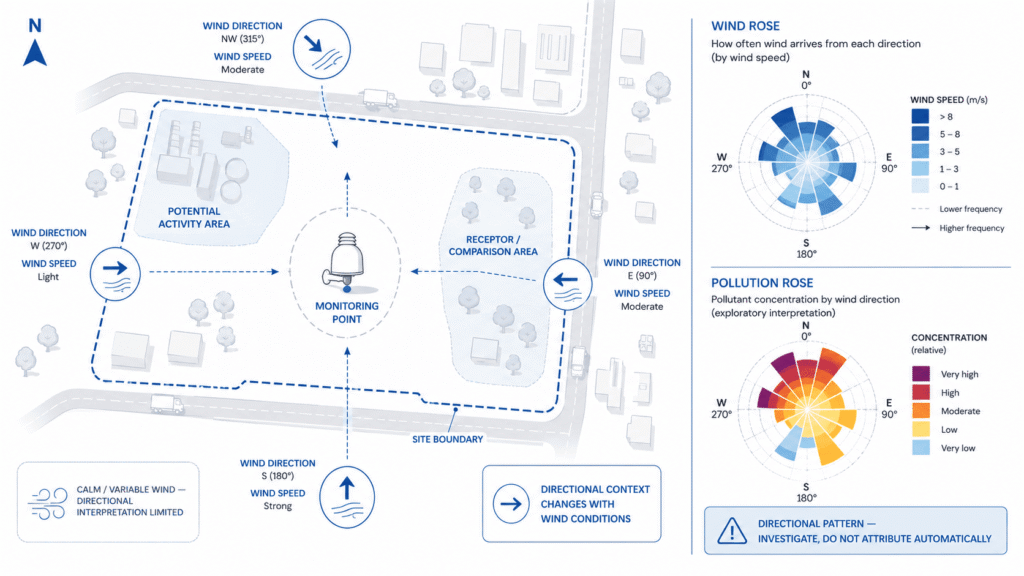
A wind rose summarises how frequently winds arrive from different directions and commonly how wind speed is distributed across those sectors. A pollution rose combines pollutant measurements with wind direction — and, depending on the analysis, wind speed — to highlight directional concentration patterns. These plots can help identify sectors that deserve further investigation. They do not identify a pollution source automatically.
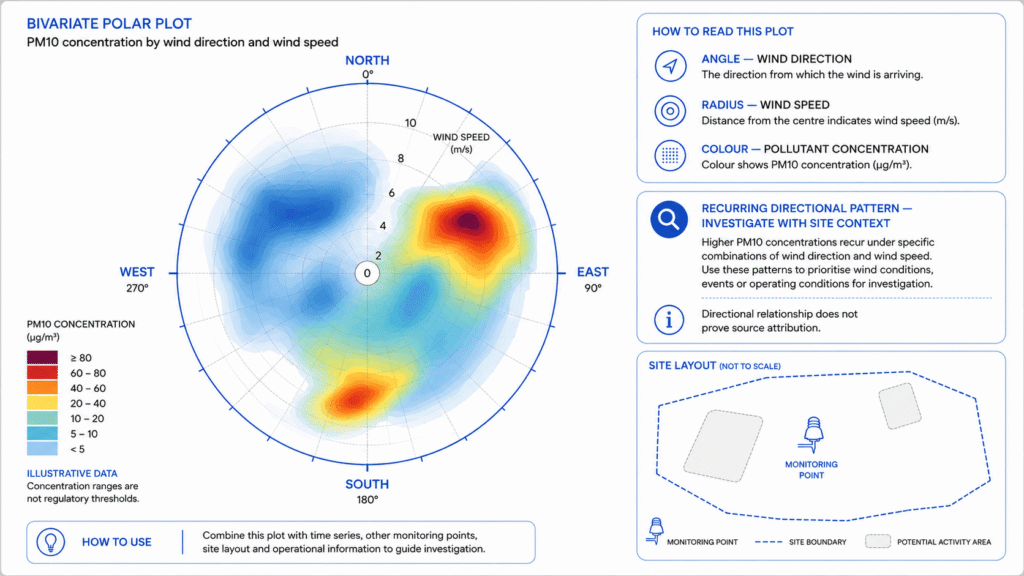
A bivariate polar plot adds wind speed to the directional analysis. The angle represents the direction from which the wind is arriving, the distance from the centre represents wind speed, and the colour scale represents pollutant concentration. This makes it possible to see whether higher concentrations recur under particular combinations of wind direction and wind speed rather than only within a directional sector. Like a pollution rose, a bivariate polar plot is an exploratory interpretation tool. It can help prioritise sectors, operating conditions or events for investigation, but it does not identify a pollution source automatically.
If elevated concentrations cluster in one directional sector only at low wind speeds, that pattern may suggest a different investigation question from a pattern that appears from the same sector under stronger, well-established airflow. The plot helps distinguish these behaviours visually, while site layout, timing, other monitoring points and operational information are still needed before a source hypothesis can be strengthened.
Temperature: mixing, stability and pollutant behaviour
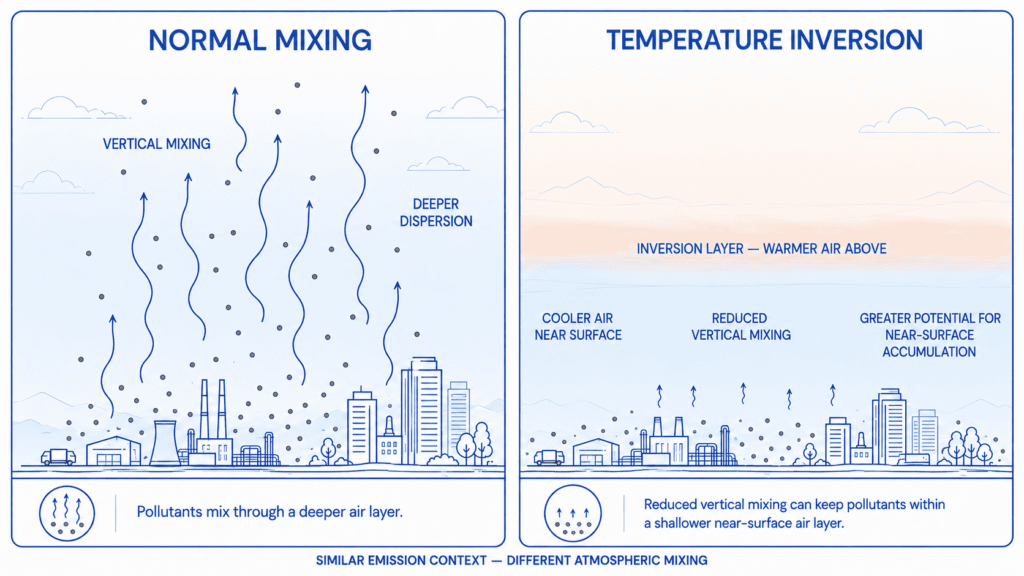
Temperature is important because it is connected to atmospheric stability, mixing and many physical and chemical processes. A surface temperature reading alone does not fully describe stability: vertical temperature structure, wind, solar heating, cloud cover and time of day all matter. Temperature should therefore be used as context rather than as a one-variable explanation for a pollution event.
Temperature inversions illustrate why near-surface concentrations can increase even without a corresponding increase in local emissions. When warmer air overlies cooler near-surface air, vertical mixing can be suppressed and pollutants can accumulate closer to the ground until meteorological conditions change. An elevated concentration during such a period may therefore reflect reduced dispersion as well as changes in emissions.
Relative humidity: aerosol behaviour and PM interpretation
Relative humidity matters particularly for particulate matter because many atmospheric particles are hygroscopic: they take up water as humidity rises. Particle growth changes optical properties and light scattering, so optical PM measurements can change as aerosol water content changes. Fog and condensation can add further complexity. Retaining RH gives the reviewer environmental context for interpreting the PM pattern responsibly.
Environmental conditions should be considered during sensor-data verification rather than treated as an afterthought. Retaining RH alongside PM makes it possible to test whether an event is consistent with a real aerosol change, hygroscopic growth, optical response, condensation / inlet conditions or a combination of influences.
Not every PM increase during humid conditions is an artefact. High RH can coincide with genuine changes in particulate concentration, and hygroscopic growth is itself a real atmospheric process. The correct response is therefore not “high RH equals bad PM data”, but a structured review of the PM record, RH, site context and applicable QA / processing status.
Temperature and humidity can influence some measurement technologies as well as the atmosphere itself. These effects belong primarily to the calibration and data-quality workflow. For event review, retain the environmental conditions with the measurement, understand the relevant QA / processing status and investigate unusual patterns rather than applying an ad-hoc correction.
What meteorological data can – and cannot – tell you
Meteorological data is most useful when its interpretive role and its limitations are explicit. The table below separates the question each parameter can help answer from conclusions it cannot establish on its own.
| Parameter | Helps interpret | Cannot establish alone | Data-quality consideration |
|---|---|---|---|
| Wind direction | Upwind sectors, directional recurrence, changing air-mass pathways | A unique source or causal attribution | Use time-aligned data and a location representative of the airflow scale being investigated. Directional interpretation is limited during calm / highly variable winds. |
| Wind speed | Stagnation, dilution, transport regime and possible resuspension context | Emission rate or a universal “clean / polluted” condition | Check local obstructions and instrument exposure; do not apply a universal calm-wind threshold. |
| Temperature / stability context | Mixing regime, inversion conditions and changing atmospheric behaviour | Atmospheric stability from surface temperature alone | Interpret with time of day, wind and other meteorological information when stability matters. |
| Relative humidity | Hygroscopic particle growth and environmental context for optical PM interpretation | Whether a concentration change is “real” or “false” by itself | Retain RH with pollutant data and interpret it alongside QA / processing status; high RH does not automatically invalidate PM data. |
A practical workflow for reviewing an air-quality event
The most useful workflow combines pollutant measurements, meteorology and operational context on the same timeline. Historical dashboards and Reporting Tools are valuable when they let the reviewer compare these variables without losing the original time structure of the event.
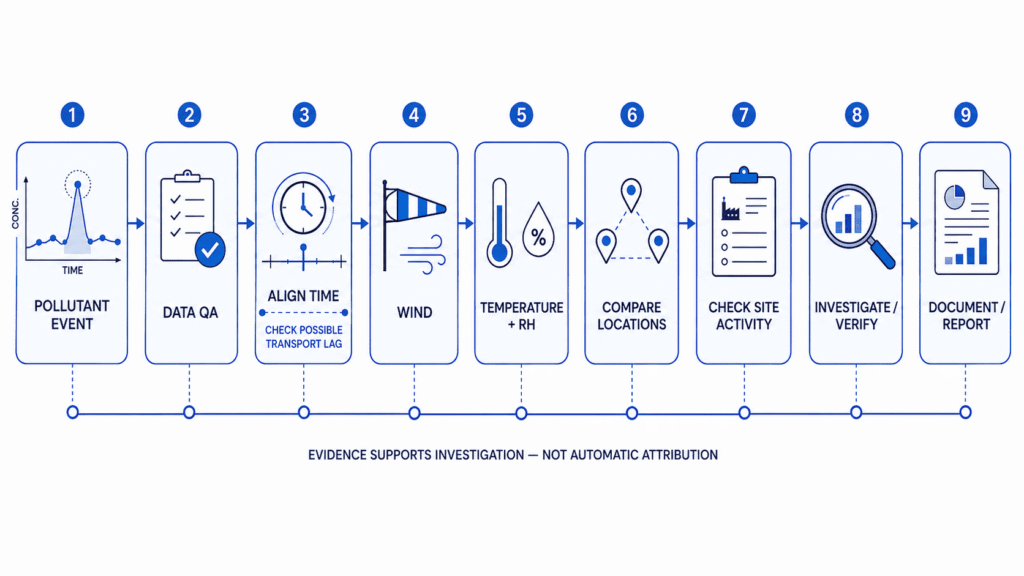
- Verify the air-quality data first. Check instrument status, flags, missing periods, calibration / adjustment status and whether neighbouring parameters or nodes support the change.
- Align time bases. Use compatible timestamps and averaging periods, but do not assume zero delay automatically. Where distance and airflow make transport time relevant, consider whether a physically plausible lag exists between activity, meteorology and concentration response. A plausible lag is context, not source proof.
- Review wind direction and speed together. Ask whether the event occurs with a persistent sector, shifting winds, calm / variable conditions or a changed airflow regime. Use wind roses, pollution roses or bivariate polar plots where they help test directional recurrence and the relationship between concentration and wind conditions.
- Check temperature and relative humidity for mixing / inversion context, hygroscopic particle growth, fog / condensation and relevant measurement QA status.
- Compare locations where a network is available. A network-wide increase may indicate a different spatial process from a short event concentrated at one boundary or operational area.
- Compare site activity and external context. Review operating logs, traffic, construction phases, maintenance or material movement without treating coincidence as causality.
- Form a working hypothesis that explains the observed timing, direction, spatial pattern and meteorological context without presenting it as a confirmed source.
- Investigate / verify the hypothesis with repeated events, additional measurements, reference comparison, a changed monitoring layout or targeted field inspection as appropriate.
- Document the event, evidence reviewed, remaining uncertainty and any justified follow-up so the interpretation remains traceable.
Time-series comparison, scatter plots, wind roses and pollution roses can help reveal relationships between pollutant measurements and meteorological conditions. Their value is exploratory: they help organize evidence and identify patterns that deserve follow-up, but they do not replace site knowledge, appropriate time resolution or corroborating evidence.
How meteorological measurements fit into a monitoring system
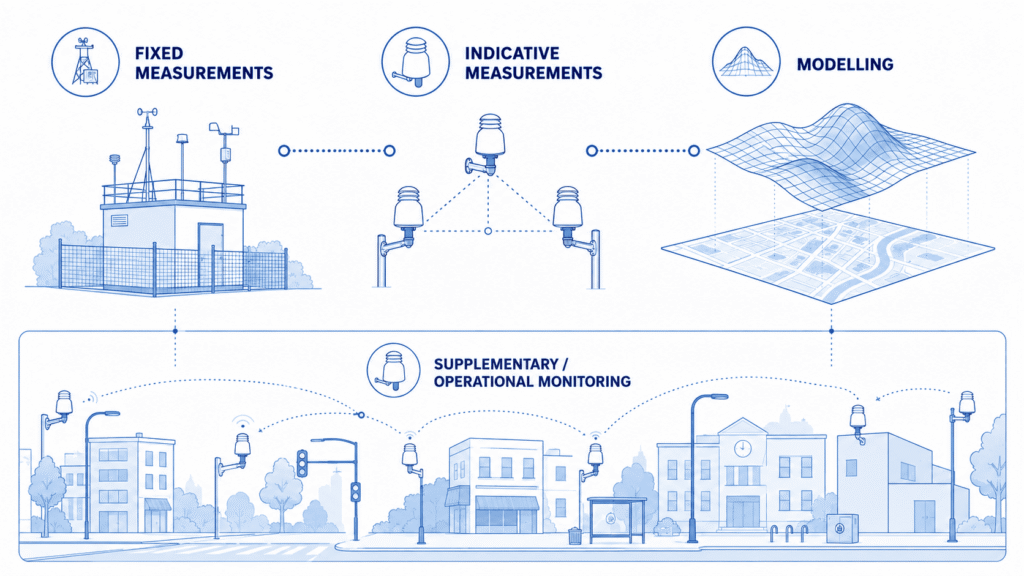
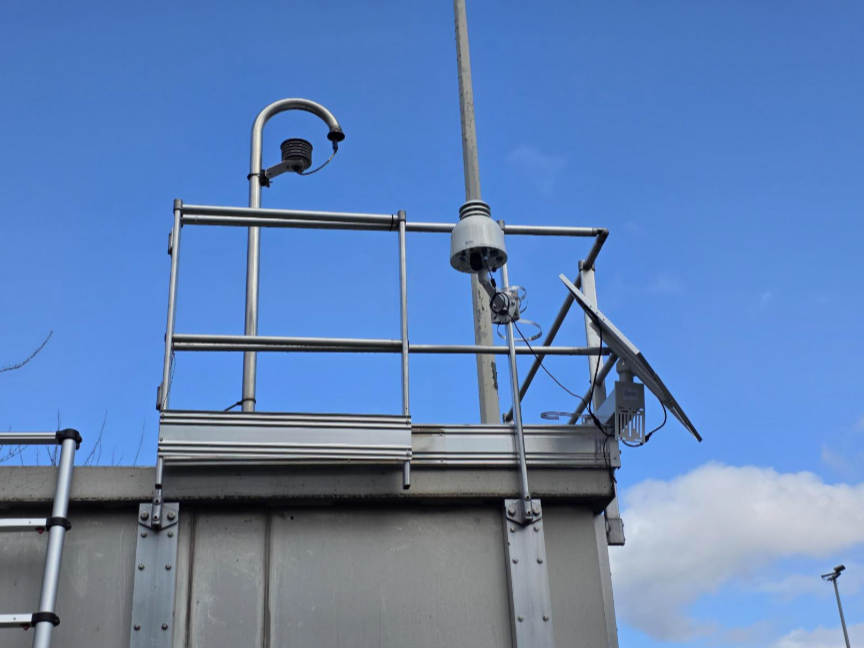
The meteorological layer should be designed around the air-quality interpretation question. Temperature and relative humidity are most useful when they describe conditions at or near the air-quality node. Wind may be measured at one representative location or at multiple locations depending on site size, obstructions and the need to distinguish local airflow patterns.
Air-quality interpretation becomes stronger when pollutant measurements are combined with complementary, quality-managed evidence such as meteorology, site activity and other relevant datasets. Meteorology is one of those evidence layers, not a substitute for pollutant measurement quality, calibration or site-specific investigation.
The Aernode Air Quality Monitor includes air temperature, relative humidity and atmospheric pressure, providing local environmental context alongside the configured air-quality measurements. Meteorological accessories can add wind speed and wind direction when the project needs local transport and directional context. This is particularly relevant in applications such as industrial perimeter monitoring, where event interpretation may depend on changing wind sectors, local obstructions and site operations.
Aernode can also integrate broader meteorological measurements for project-specific environmental monitoring, but those uses are outside the air-quality-interpretation scope of this Guide. Reporting Tools can support real-time and historical comparison of air-quality measurements with meteorological or other connected datasets without turning a directional relationship into an automatic source conclusion.
A practical minimum for useful meteorological context
Not every project requires a full weather station. The minimum useful set depends on the decision the monitoring programme must support. As a practical starting point:
- Record temperature and relative humidity with pollutant measurements when they help interpret mixing conditions, particulate behaviour or the environmental context of an unusual event.
- Add local wind speed and direction when the objective includes directional event review, source-area investigation, boundary interpretation or pollutant transport across a site.
- Identify calm or highly variable wind periods explicitly and avoid interpreting them as if they represented persistent transport from one sector.
Use meteorological measurements that are representative of the spatial scale being investigated, and document major nearby obstructions when local airflow matters.
- Keep timestamps, units and averaging periods consistent enough to compare pollutant, meteorological and activity data, while considering physically plausible transport lag when the site geometry makes it relevant.
- Preserve meteorological data through the QA and reporting workflow rather than using it only during setup.
- Use meteorological variables as contextual evidence, not as an automatic correction, compliance decision or source-attribution engine.
The central question is simple: under what atmospheric conditions did the concentration change? Wind, temperature and relative humidity turn an isolated concentration trace into a more structured investigation while preserving the essential safeguards: concentration is not cause, wind sector is not source proof, temporal coincidence is not causality, and meteorology does not replace data QA.
Technical References
1. European Environment Agency. Dispersal of air pollutants.
2. European Environment Agency. Temperature inversion traps pollution at ground level.